> For the complete documentation index, see [llms.txt](https://help.connected.illumina.com/llms.txt). Markdown versions of documentation pages are available by appending `.md` to page URLs; this page is available as [Markdown](https://help.connected.illumina.com/dragen-stratamap/illumina-connected-multiomics/spatial-analysis.md).
# Spatial Analysis
## Analysis Creation Per Sample
After sample data has been ingested into a study, there are two ways a **default sample analysis** can be initiated: Manual Analysis Creation or Auto Analysis Creation
### Manual Analysis Creation (Recommended)
This option is manually initiated by using the "+ New Analysis" button in the upper right hand corner of any study page:
Upon selecting the "+ New Analysis" button, you will be prompted to enter 'Analysis Name', 'Analysis Type (Default: Illumina Spatial Transcriptomics), and the 'Sample(s)' data you'd like to analyze from a drop down menu.
Once these required fields are completed, proceed by selecting the "Run Analysis" button on the bottom right:
### Auto Analysis Creation
Within the settings of any study page ("Gear" icon at the top right), an "Update study" pop-up will appear and there will be an option to "Automatically create single sample default analyses". This will enable the Auto Analysis Creation feature for **all new samples** added to the study.
It is generally recommended to leave this feature OFF.
* **If you wish to enable this feature, check the two boxes in the screenshot below and then select "Update":**
## The Analyses Tab
The Analyses tab is used to display the task graph, view the results, and invoke tasks using the context-sensitive toolbox.
### Data Nodes and Task Nodes
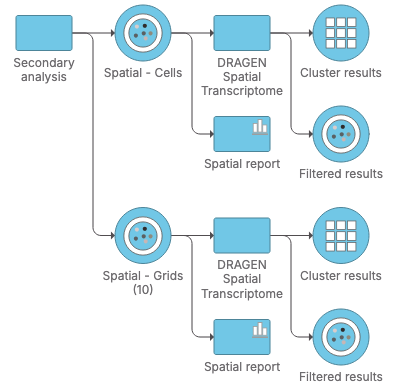
The Analyses tab contains two elements: data nodes (circles) and task nodes (rectangles) connected by lines and arrows.
Collectively, they represent a data analysis pipeline (task graph).
Example of a Default Sample Analysis Task Graph
### Performing Tasks
#### Data Node Actions
Clicking a data node brings up a context sensitive menu (toolbox) on the right. This menu changes depending on the type of data node selected.
Make a task selection from the toolbox to perform this task on the selected data node:
After selecting a data node (circled in bold on the task graph on the left), the toolbox will appear on the right (boxed in blue)
#### Task node actions
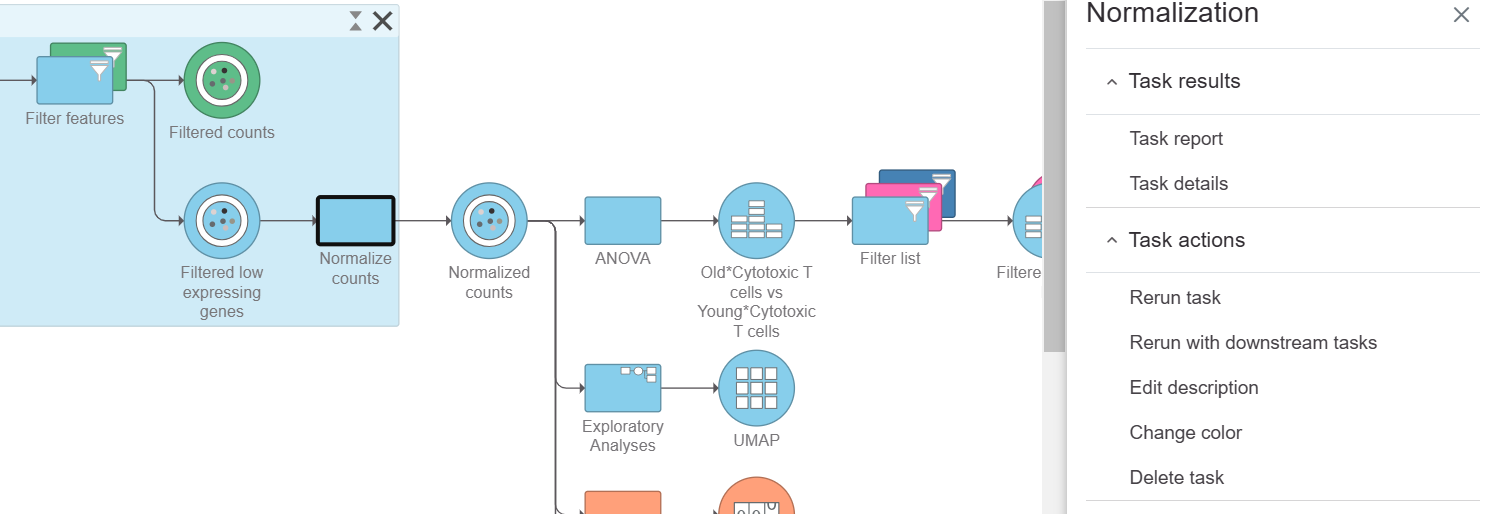
Clicking a task node brings up task results and task actions. Task node (rectangle) actions on the task menu (toolbox) allow you to rerun tasks, rerun with downstream tasks, edit the description, and change the color.
Select a task node to re-run tasks using the context-sensitive toolbox
* **Rerun tasks:** rerun the selected task, the task dialog will pop-up and users can change parameters of the task. Previous downstream analysis of the selected task will not be rerun.
* **Rerun with downstream tasks**: rerun the selected task, the task dialog will pop-up, users can change the parameters of the current task and the downstream analysis will be rerun with the same configuration as the previous one.
* **Edit description**: the description of the task can be replaced by manually typing in string.
* **Change color**: choose a color to apply only on the selected task by clicking on Apply. Click Apply to downstream to change the selected task and the downstream pipeline color to the newly selected color.
---
# Agent Instructions
This documentation is published with GitBook. GitBook is the documentation platform designed so that both humans and AI agents can read, navigate, and reason over technical content effectively. Learn more at gitbook.com.
## Querying This Documentation
If you need additional information that is not directly available in this page, you can query the documentation dynamically by asking a question.
Perform an HTTP GET request on the current page URL with the `ask` query parameter, and the optional `goal` query parameter:
```
GET https://help.connected.illumina.com/dragen-stratamap/illumina-connected-multiomics/spatial-analysis.md?ask=&goal=
```
`ask` is the immediate question: it should be specific, self-contained, and written in natural language.
`goal` is optional and describes the broader end goal you are ultimately trying to accomplish on behalf of the user. GitBook uses it to tailor the answer towards what is most useful for that goal.
The response will contain a direct answer to the question and relevant excerpts and sources from the documentation.
Use this mechanism when the answer is not explicitly present in the current page, you need clarification or additional context, or you want to retrieve related documentation sections.
%20(1).png?alt=media)
.png?alt=media)
%20(1).png?alt=media)
%20(1).png?alt=media)