> For the complete documentation index, see [llms.txt](https://help.connected.illumina.com/llms.txt). Markdown versions of documentation pages are available by appending `.md` to page URLs; this page is available as [Markdown](https://help.connected.illumina.com/dragen-stratamap/illumina-connected-multiomics/spatial-data-viewer.md).
# Spatial Data Viewer
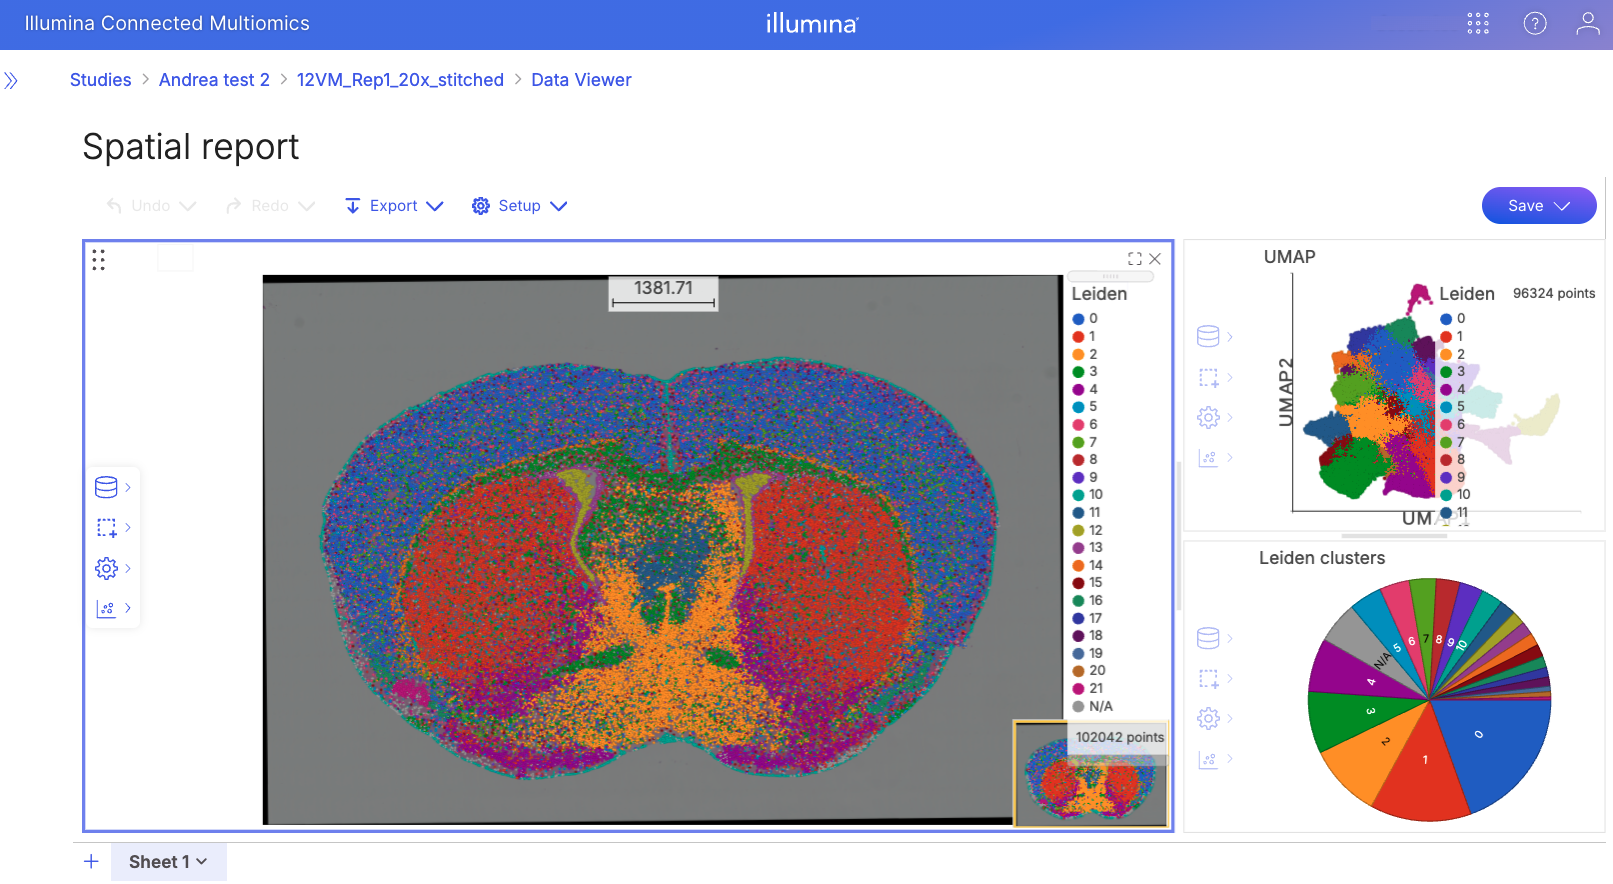
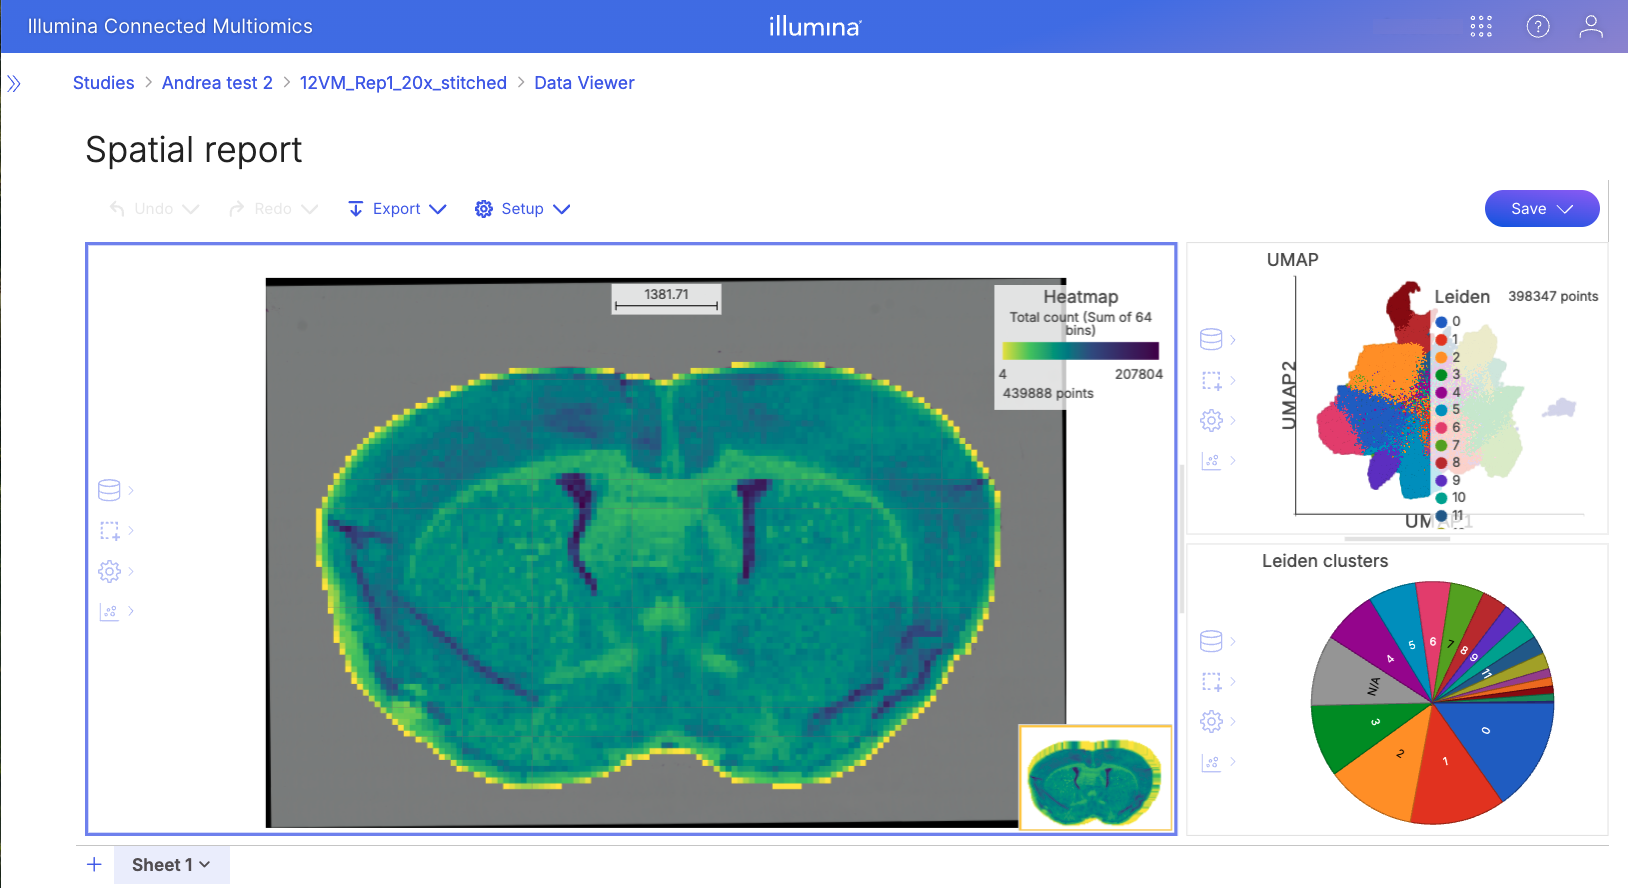
## The Spatial Report includes:
* The tissue image with cell or grid bin spatial data overlay
* The UMAP plot colored by cluster
* A pie chart representing the clusters
{% hint style="info" %}
The coordinates for the spatial image correspond to the original flow cell.
{% endhint %}
The data opens to the **cell binned data Spatial report**. The graphs are based on the cell binned data and colored by Leiden clusters. To change the colors, see [Configuring Spatial Images](/dragen-stratamap/illumina-connected-multiomics/spatial-data-viewer/configuring-spatial-images.md). The tissue image has the cells overlaid, so if you zoom in to the tissue image, you will see the individual cells.
The grid binned Spatial report has plots based on the grid binned data. This will include all transcripts in the sample, as it includes the space between cells. The tissue image is initially colored by total count of transcripts. To change the colors, see [Configuring Spatial Images](/dragen-stratamap/illumina-connected-multiomics/spatial-data-viewer/configuring-spatial-images.md).
## The Task Graph
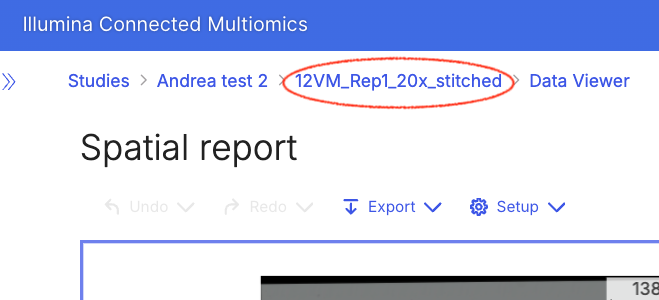
To navigate to the task graph, click on the sample name just above the left menu:
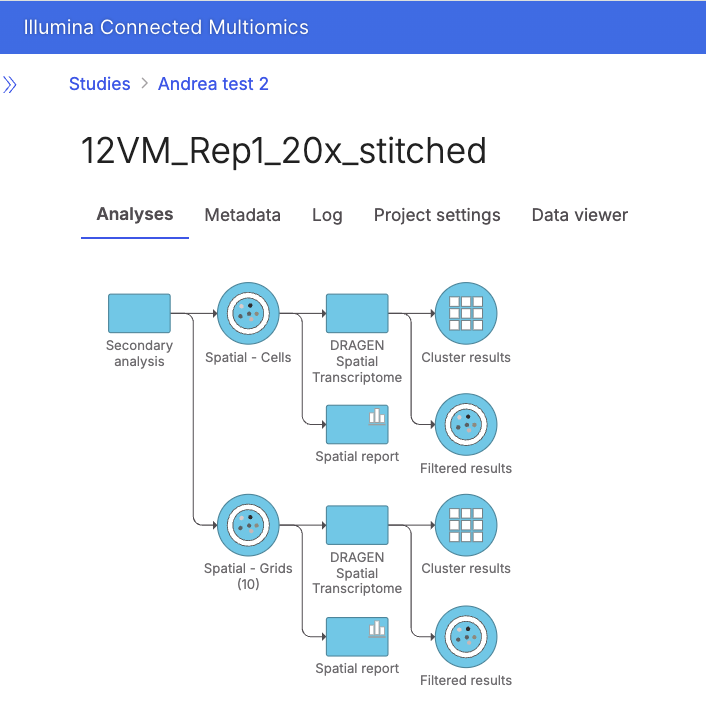
The task graph displays analysis output from the DRAGEN StrataMap software. The defaults are for cell binned data and 10µm grid binned data. Additional sizes of grid binned data, if generated, will populate here as well.
To navigate back to the cell spatial report from the task graph, double click the 'spatial report' downstream of the "Spatial - Cells" data node. The spatial report downstream of the "Spatial - Grids" data node will take you to the grid binned spatial report.
---
# Agent Instructions
This documentation is published with GitBook. GitBook is the documentation platform designed so that both humans and AI agents can read, navigate, and reason over technical content effectively. Learn more at gitbook.com.
## Querying This Documentation
If you need additional information that is not directly available in this page, you can query the documentation dynamically by asking a question.
Perform an HTTP GET request on the current page URL with the `ask` query parameter, and the optional `goal` query parameter:
```
GET https://help.connected.illumina.com/dragen-stratamap/illumina-connected-multiomics/spatial-data-viewer.md?ask=&goal=
```
`ask` is the immediate question: it should be specific, self-contained, and written in natural language.
`goal` is optional and describes the broader end goal you are ultimately trying to accomplish on behalf of the user. GitBook uses it to tailor the answer towards what is most useful for that goal.
The response will contain a direct answer to the question and relevant excerpts and sources from the documentation.
Use this mechanism when the answer is not explicitly present in the current page, you need clarification or additional context, or you want to retrieve related documentation sections.