> For the complete documentation index, see [llms.txt](https://help.connected.illumina.com/llms.txt). Markdown versions of documentation pages are available by appending `.md` to page URLs; this page is available as [Markdown](https://help.connected.illumina.com/dragen-stratamap/illumina-connected-multiomics/spatial-data-viewer/configuring-spatial-images.md).
# Configuring Spatial Images
### Navigate spatial image
* To zoom in and out, scroll with mouse or trackpad
* To move the plot and image, right click and drag, or with a trackpad, use two fingers to click and drag.
### Adjust Spatial settings
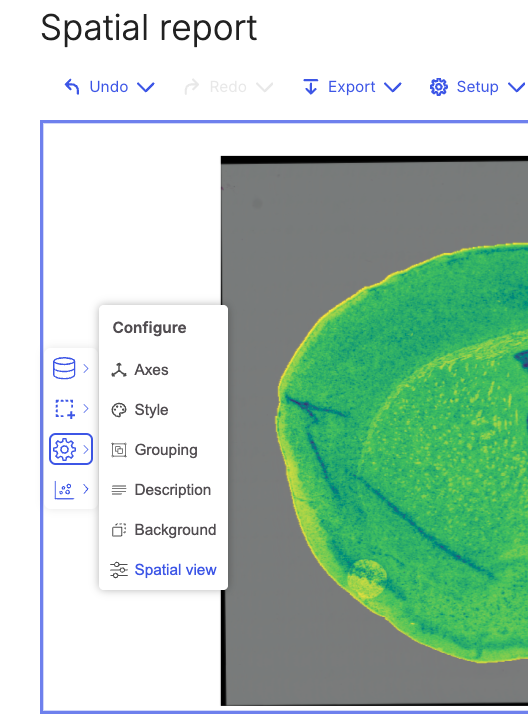
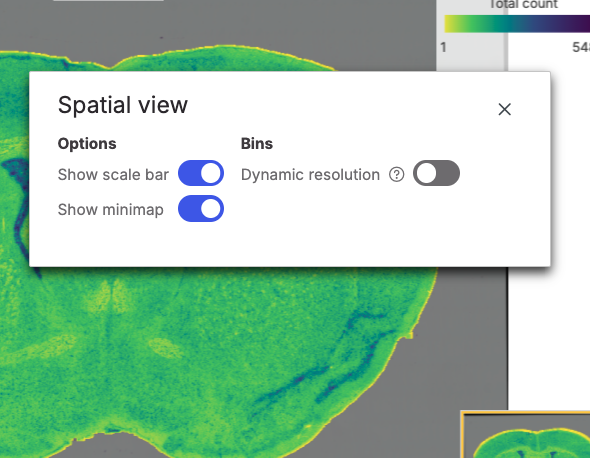
To adjust spatial specific settings, click the gear icon in toolbar to the left of the spatial image. Click "Spatial view" to see the options.
* **Scale bar** - length in microns as a reference
* **Minimap** - the small display of the whole sample image, which indicates what part of the overall image you are viewing when zoomed in.
* **Dynamic resolution** (only for grid binned data) - the plot displays summarized data when zoomed out, and more detail as you zoom in. Turning this off will load and display all data at the actual resolution (ex 10µm bin).
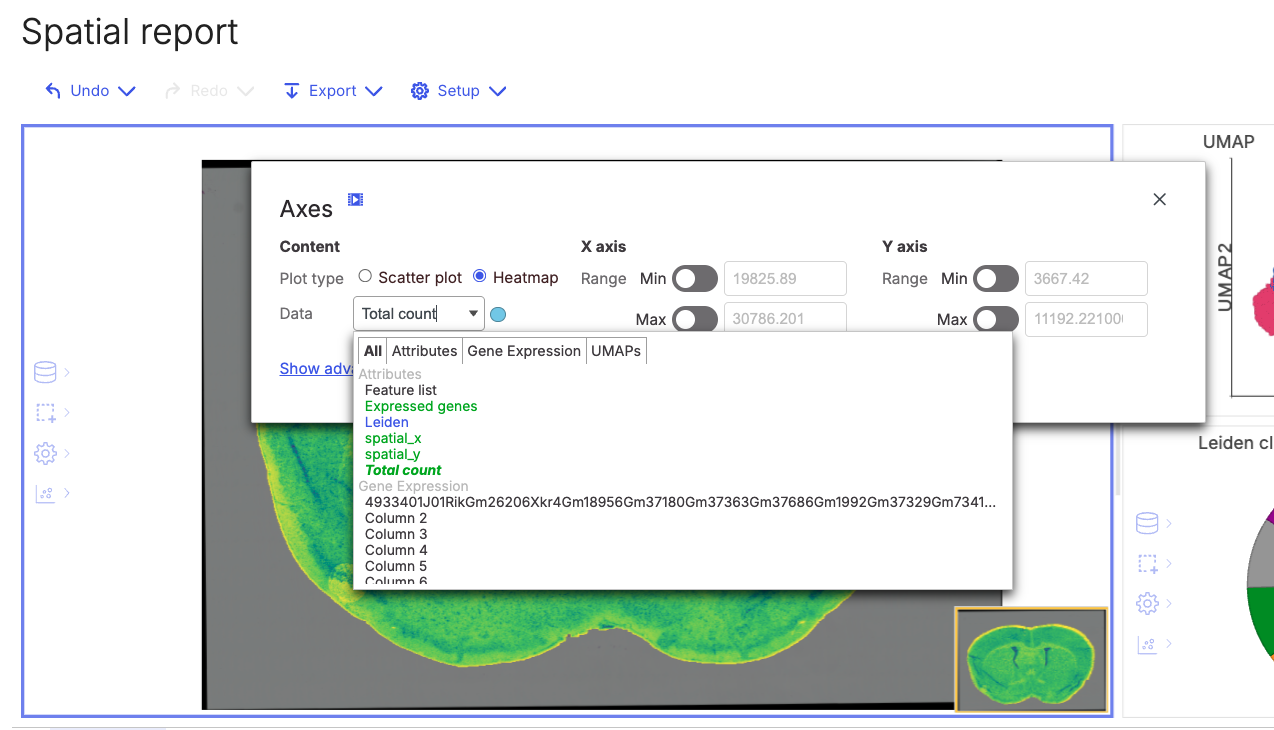
### Bin coloring - grid binned data
Navigate to **Configure > Axes > Content > Data**. Select an attribute to color the plot. For example:
* Leiden - color by cluster
* Expressed genes - color by the number of unique expressed transcripts
* Total count - the total number of transcripts expressed
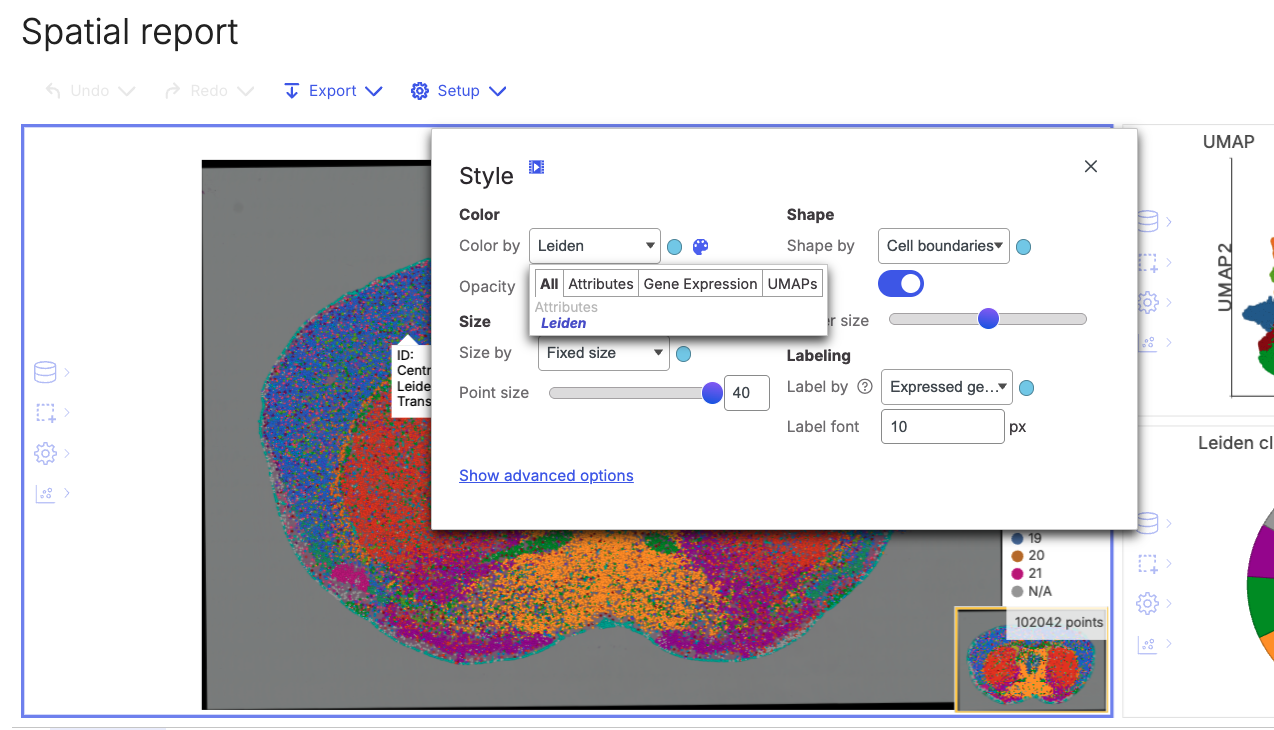
### Bin coloring - cell binned data
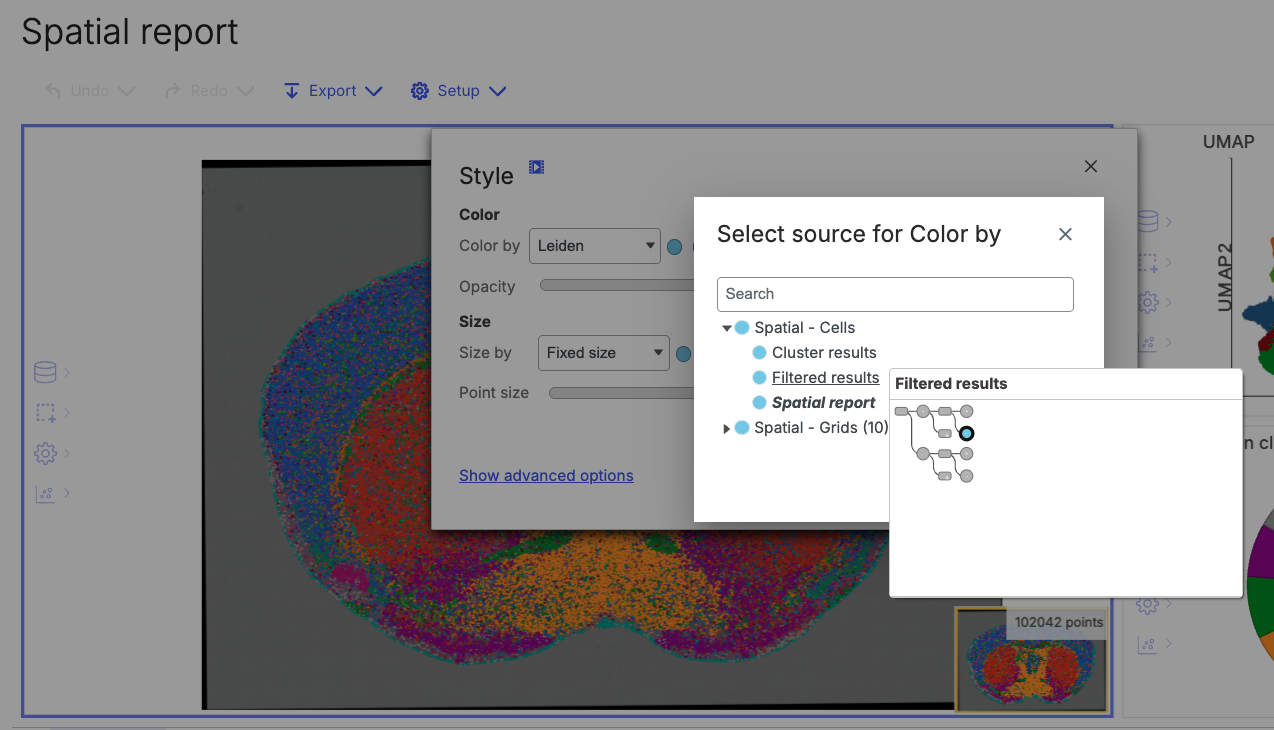
Navigate to **Configure > Style > Color > Color by**. Select an attribute to color the plot. For example:
* Leiden - color by cluster
* Expressed genes - color by the number of unique expressed transcripts
* Total count - the total number of transcripts expressed
For both cell and grid binned data you can choose to color the plots with data generated from other tasks by clicking the blue circle beside the dropdown menu and choosing the data from the mini task graph
### Highlight a cluster across plots
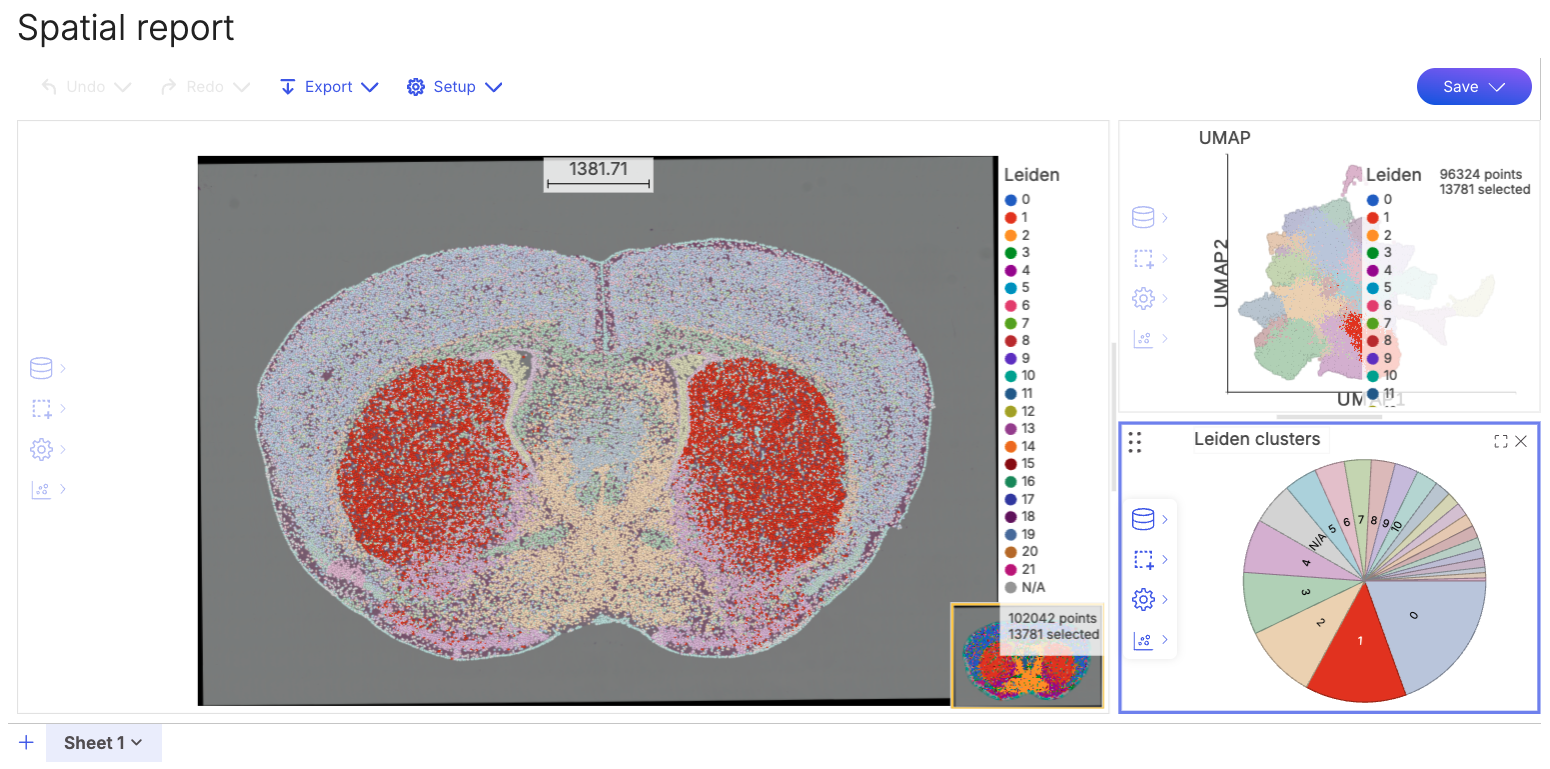
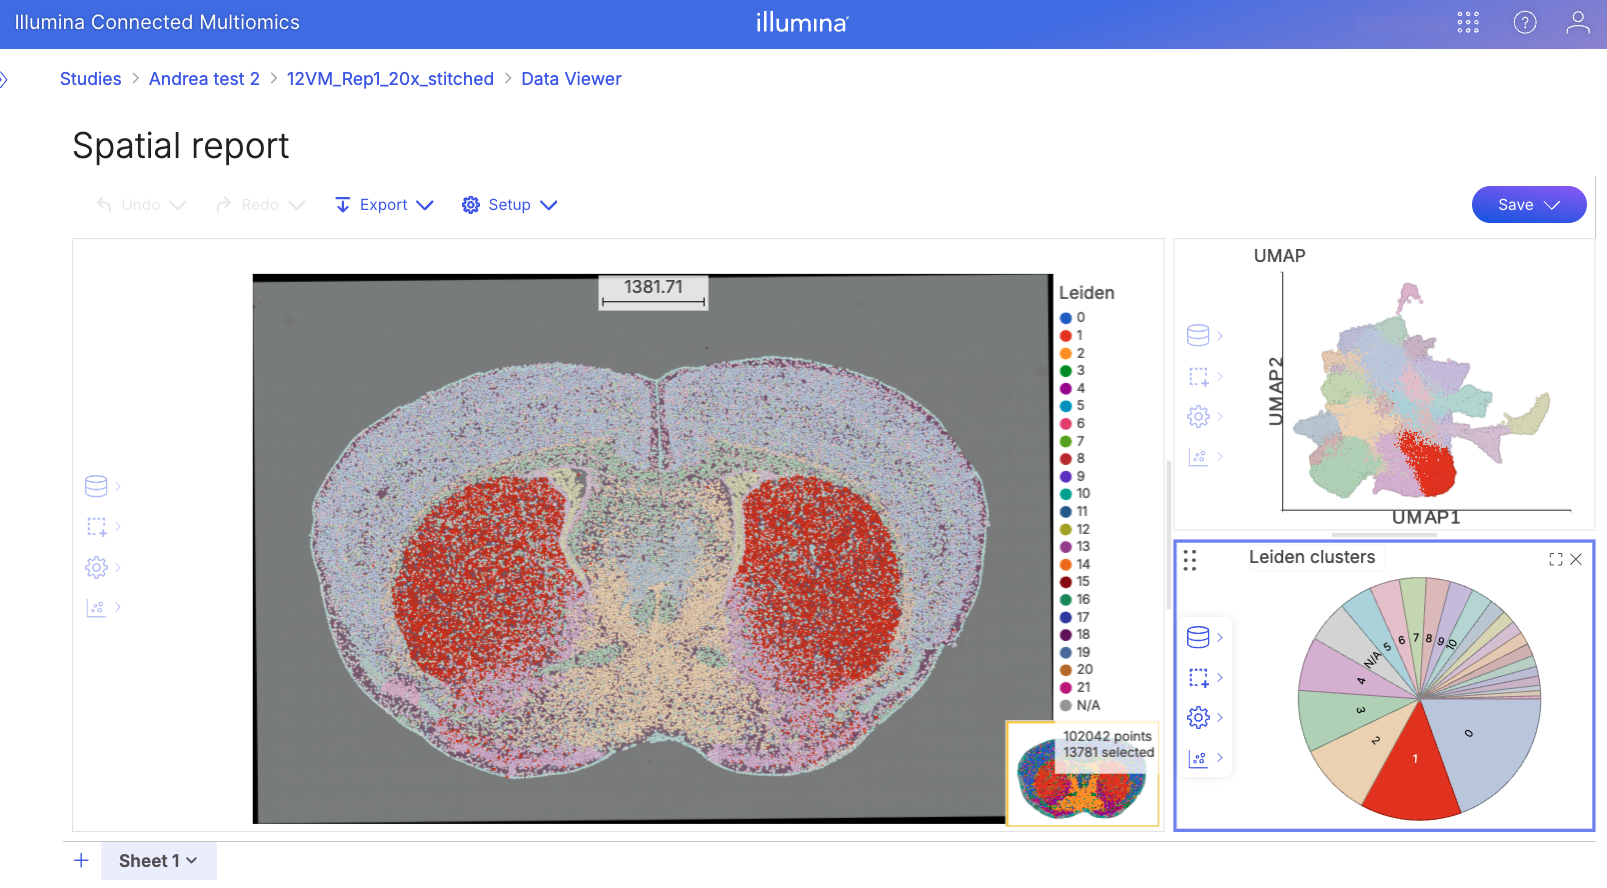
All the data in the spatial report is linked. Click on a cluster in the pie graph to highlight only that cluster across all plots. To remove the selection, click just outside the pie graph.
### Save Data Viewer session
Save a session of the data viewer with any changes you have made to plots by clicking the "save" button at the top right. If it is from the spatial report you will "save as" a new data viewer session. Later updates to data viewer sessions can be saved into the already existing session
That session can now be viewed from the Data Viewer page. You can navigate to the data viewer page by clicking the text at the top of the page.
---
# Agent Instructions
This documentation is published with GitBook. GitBook is the documentation platform designed so that both humans and AI agents can read, navigate, and reason over technical content effectively. Learn more at gitbook.com.
## Querying This Documentation
If you need additional information that is not directly available in this page, you can query the documentation dynamically by asking a question.
Perform an HTTP GET request on the current page URL with the `ask` query parameter, and the optional `goal` query parameter:
```
GET https://help.connected.illumina.com/dragen-stratamap/illumina-connected-multiomics/spatial-data-viewer/configuring-spatial-images.md?ask=&goal=
```
`ask` is the immediate question: it should be specific, self-contained, and written in natural language.
`goal` is optional and describes the broader end goal you are ultimately trying to accomplish on behalf of the user. GitBook uses it to tailor the answer towards what is most useful for that goal.
The response will contain a direct answer to the question and relevant excerpts and sources from the documentation.
Use this mechanism when the answer is not explicitly present in the current page, you need clarification or additional context, or you want to retrieve related documentation sections.