> For the complete documentation index, see [llms.txt](https://help.connected.illumina.com/llms.txt). Markdown versions of documentation pages are available by appending `.md` to page URLs; this page is available as [Markdown](https://help.connected.illumina.com/dragen-stratamap/illumina-connected-multiomics/spatial-data-viewer/selections.md).

# Selections

{% hint style="info" %}
Notes on selections:

* Data selections are applied to all plots in a Data viewer sheet if the plots are sharing the data node data plotted. The number of selected points is listed in the Legend on the plot.
* By default, selected points are shown in bold while deselected points are *Dim* (colors not as bright). Deselected points display can be changed to *None* or *Gray* (not colored but instead gray) in the *Selections* tool in the left panel.
* One bin (cell or grid) can only be in one selection, they can be re-classified when making a new selection.
* An individual selection can be comprised of non-connected regions.
  {% endhint %}

## Manual Selections (in-plot tools)

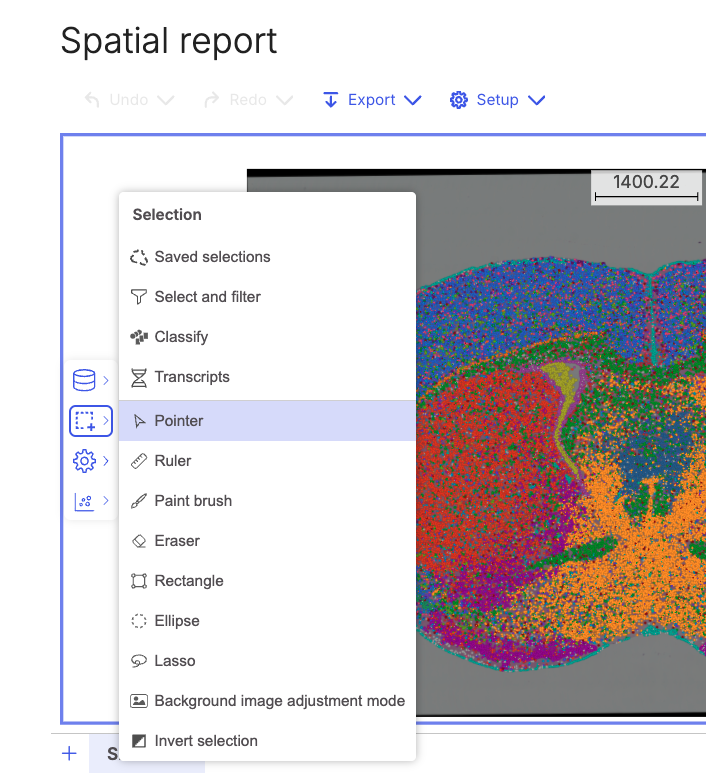
To use the Selections feature, choose it from the left navigation bar

<figure><img src="/files/YqtgvvfKhLK4gm2UNSZr" alt="" width="530"><figcaption></figcaption></figure>

### Pointer mode

The most basic way to select a point on is to click it with the mouse while in pointer mode. Click ![](/files/wwYpCbLqnWzsTKahllRW) to activate pointer mode if it is not currently active. To select multiple points, you can hold Ctrl on your keyboard and click the cells. To deselect a previously-selected point, hold Ctrl and click it again.

### Paint, Lasso, Rectangle, and Ellipse modes

To select larger groups of points, you can switch to Paint, Lasso, Rectangle, and Ellipse modes by clicking the plot controls on the right hand side.

#### Paint mode

Paint to select points.

* Click ![](/files/B6GliqLUtFfJdQu9TNx3) to activate Brush mode
* Use the slider at the top of the plot to adjust the brush size
* Click individual sections within the plot
* Click hold and drag the mouse to make larger selections

#### Lasso mode

Freely draw a shape to select a cluster of points.

* Click ![](/files/FJj5PfOy6HTm3huiLTnH) to activate Lasso mode
* Left-click and hold to draw a lasso around a cluster of points
* Release and click the starting circle to close the lasso and select the enclosed points

You can also create a lasso with straight lines using Lasso mode by clicking, releasing, and clicking again to draw a shape.

#### Rectangle mode

Draw a rectangle to select points.

* Click ![](/files/omKDHBsRi7FFF69mf5q0) to activate Rectangle mode
* Click the leftmost area to select, hold and drag to complete the rectangle selection

#### Ellipse mode

Draw an ellipse to select points.

* Click ![](/files/ykvDYTDlNw1DZAoD9rti) to activate Ellipse mode
* Click the leftmost area to select, then hold and drag the ellipse to cover the area intended for selection

### Eraser mode

Use Eraser mode to deselect points that have been previously selected.

* Click ![](/files/cnpTipyHdWrAWiyCEWEM) to activate Eraser mode
* Use the slider at the top of the plot to adjust the eraser size
* Click to deselect individual points, or click and drag to deselect multiple points

### Plot interactivity

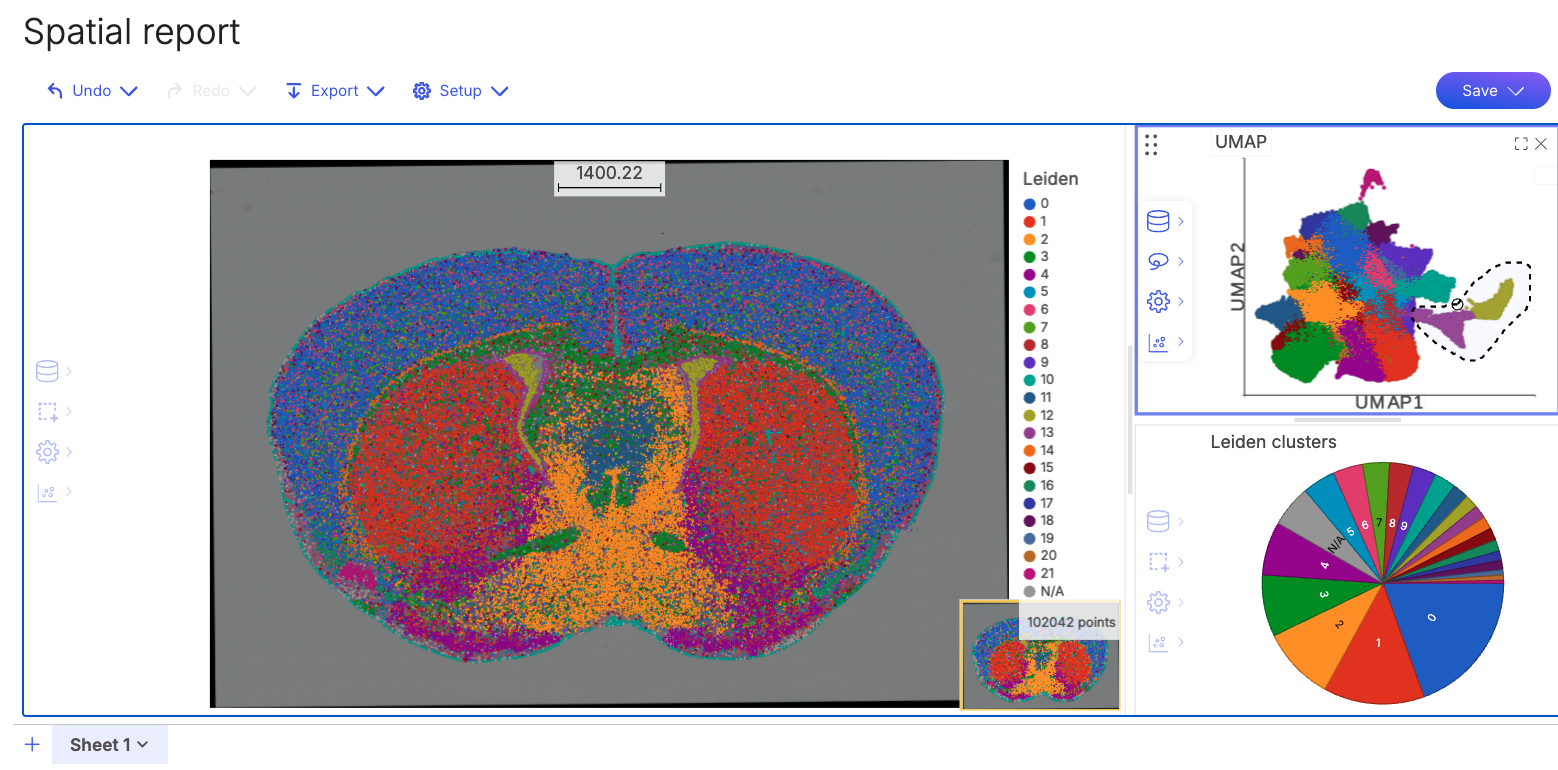
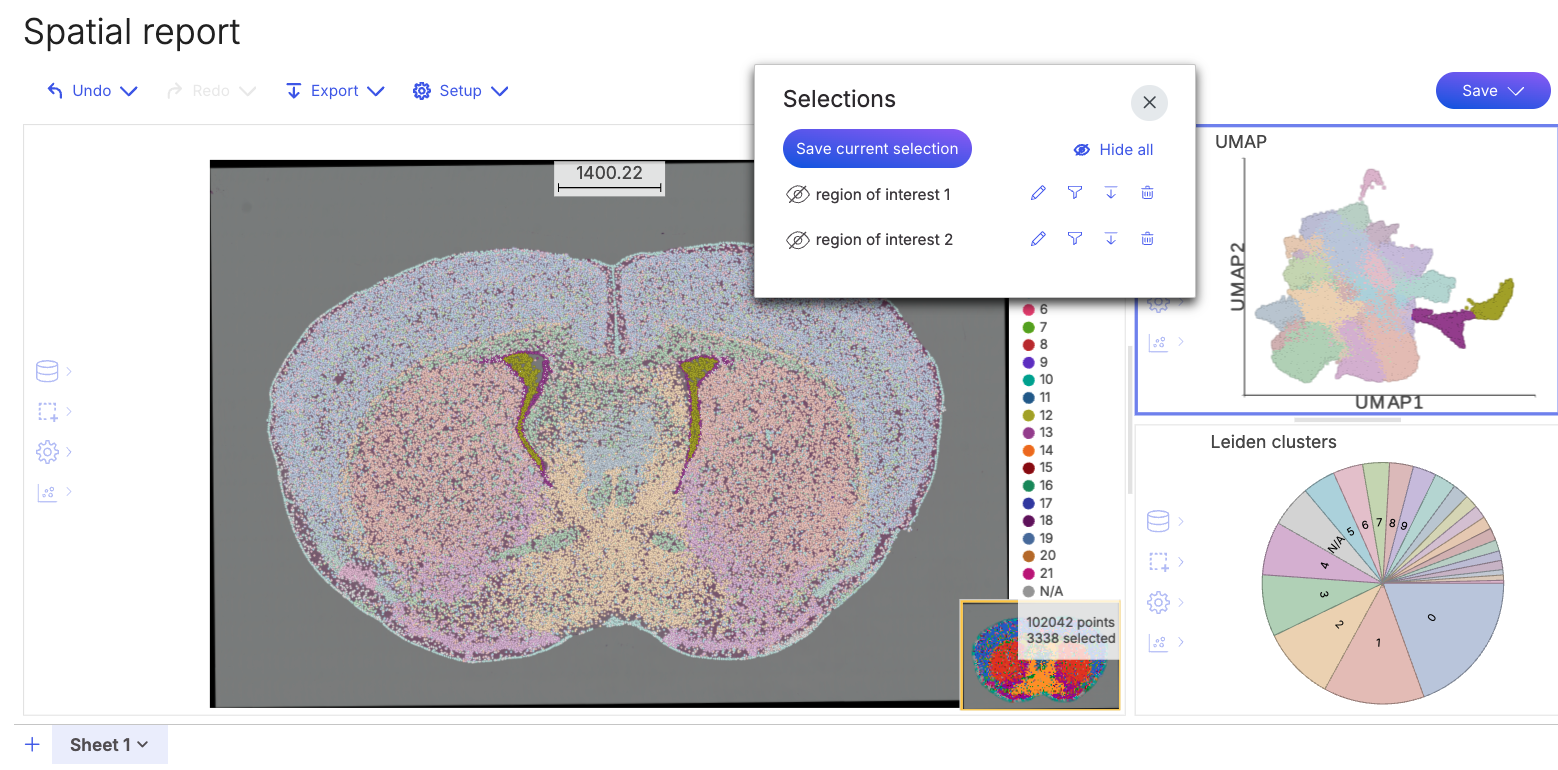
The plots in the Spatial report are connected, so making a selection in one will display highlight the selected datapoints in all other plots

For example, the following lasso selection in the UMAP plot highlights just those cells in the other plots.

<figure><img src="/files/Jbl0vm3xBP5cEP3Tb4pA" alt="" width="563"><figcaption></figcaption></figure>

<figure><img src="/files/t4Bw0erqBYGDYGncYzig" alt="" width="563"><figcaption></figcaption></figure>

{% hint style="info" %}
Click in the white space around any plot to remove the selection.
{% endhint %}

### Saving selections

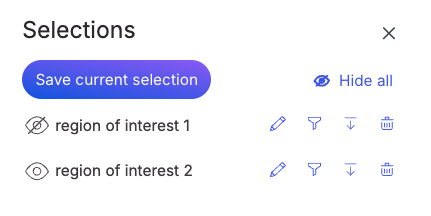
After points have been selected using a tool, click ![](/files/92DjrfHPfh23FB0vhC8S) to save the selection. You will be prompted to label the selection. A point may only belong to one selection at a time; if you save a previously-selected point to a new selection, it will be removed from the first selection.

Saved selections will be listed in the Selections dialog.

<h4 align="center"><img src="/files/4IkDlE9ejmwQBfp4Ere3" alt=""></h4>

#### Editing saved selections

* Click ![](/files/I2ySA4GwS0iYd3jq1J6b) to edit a selection
* While in edit mode, you can change the selection's label or use any selection mode to add or remove points
* When you are done editing, click ![](/files/XwxrtwdO9dwXEeEnfi2g) to apply your changes, or ![](/files/TFkl6QeQ55KlTXL8Vizw) to discard them

#### Deleting saved selections

* Click ![](/files/4tUKqiFZ1AVgiprkzaVJ) to remove a previously-saved selection

## Select & Filter selections

### Manual selection mode

A filter can be applied on a selected that has been saved to only include the points within that selection.

* Click ![](/files/REYKogt3DPr5Pxbq3XYK) on a selection to apply a filter on the selection.
* If a filter has been applied on a selection, click ![](/files/EQrcpKfi5t2MdF6kHXeq) to remove the filter.
* A filter can only be applied on one selection at a time.

## Exporting selections

The expression counts for transcripts expressed in points within a selection can be exported and downloaded.

* Click <img src="/files/nEsVDsey2aQNsLiDsyoS" alt="" data-size="line"> on a selection to start exporting its transcripts.
* The transcripts will be downloaded as a tab-seperated file, with one row per cell/bin and one column per transcript.

### Criteria selection mode

Points can be selected using any criteria available for the data node that is selected in the *Select & Filter* tool.

Data can be dragged directly to **Add criteria** or use the drop-down to generate selections. When criteria are added, the dialogue will grow with the selections. Remove the selections by clicking ![](https://help.partek.illumina.com/~gitbook/image?url=https%3A%2F%2Fdocumentation.partek.com%2Fdownload%2Fattachments%2F44598007%2Fimage2022-6-2_12-40-10.png%3Fversion%3D1%26modificationDate%3D1654188010842%26api%3Dv2\&width=40\&dpr=4\&quality=100\&sign=42322839\&sv=2).

To change the data selection click the circle (data node) and select the data node which contains the data intended for selection. Ensure the correct data node is selected by hovering on the circle. If not using the intended data node, click the circle and select the data node that contains the information intended for selection. Add criteria for selection contained within the data node.

* If this is a categorial attribute (e.g. clusters), use the check boxes to make a selection.
* If this is a feature expression value a histogram can be used to select expression thresholds. When modifying criteria by low or high values, **pin histogram** lets you see multiple histograms at a time. Use the slider or manually enter values for selection. Invert can be used to include or exclude selections. Histograms are colored according to selections; dark blue is the current selection, gray is data outside the current selection (i.e. the positions of the slider handles), and light blue is data that is within the slider’s selected region but is currently deselected by other criteria.
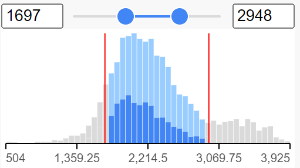
<figure><img src="/files/ZLywxxejTeR7M0kJDcK4" alt=""><figcaption><p>Histograms are colored according to selections; dark blue is the current selection, gray is data outside the current selection (i.e. the positions of the slider handles), and light blue is data that is within the slider’s selected region but is currently deselected by other criteria</p></figcaption></figure>


---

# Agent Instructions
This documentation is published with GitBook. GitBook is the documentation platform designed so that both humans and AI agents can read, navigate, and reason over technical content effectively. Learn more at gitbook.com.

## Querying This Documentation
If you need additional information that is not directly available in this page, you can query the documentation dynamically by asking a question.

Perform an HTTP GET request on the current page URL with the `ask` query parameter, and the optional `goal` query parameter:

```
GET https://help.connected.illumina.com/dragen-stratamap/illumina-connected-multiomics/spatial-data-viewer/selections.md?ask=<question>&goal=<endgoal>
```

`ask` is the immediate question: it should be specific, self-contained, and written in natural language.
`goal` is optional and describes the broader end goal you are ultimately trying to accomplish on behalf of the user. GitBook uses it to tailor the answer towards what is most useful for that goal.

The response will contain a direct answer to the question and relevant excerpts and sources from the documentation.

Use this mechanism when the answer is not explicitly present in the current page, you need clarification or additional context, or you want to retrieve related documentation sections.
