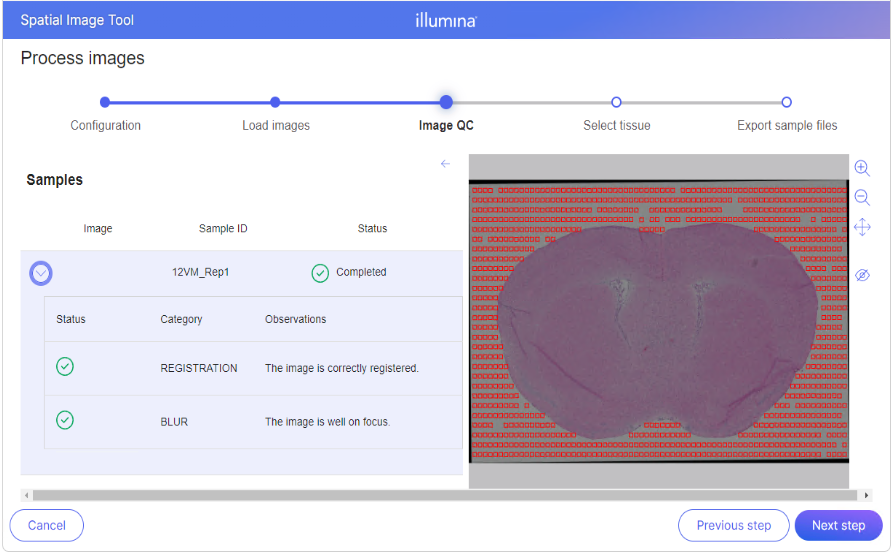
Image QC
The Image QC step evaluates uploaded images against quality and registration standards to ensure accuracy and consistency in downstream analyses.
During this process:
Images are registered to a standard coordinate system with a resolution of 1 μm/pixel.
Each image is transformed into an upright position aligned with the slide, based on detected fiducial markers.
A QC status is reported, categorizing image quality and highlighting any issues that may impact analysis.
This evaluation helps identify problems early, reducing the risk of errors in subsequent steps.
Image QC Page
The Image QC page is designed to streamline the review process and includes:
A list of QC results for all uploaded samples displayed on the left panel.
An image preview on the right panel, which updates dynamically as you select individual notices from the list.
To view detailed QC information for a sample, click the caret next to the sample name.

Note: The number and placement of fiducial markers in the QC sample image can differ between samples. Some images may show a dense grid of markers in the surrounding white area, while others may have markers mainly along the tissue edges. This variation is normal and does not indicate any error in image registration or QC status.
QC Result Levels
QC results are grouped into the following categories:
Passed
The checks for this category were successful, indicating no identified issues that could impact future analyses.
Info
Observations were made that may warrant attention, but they do not impact the validity of the results. No action is required at this time.
Warning
Issues were detected. Proceeding is possible, though some experiences may be degraded.
Failed
Critical issues were identified. The image must be corrected before proceeding. This may involve fixing configuration errors or retaking the image.
Interpreting Blur Information Signal and Blur Heat Maps
An in-focus image is ideal for downstream analysis, such as cell segmentation.
If a Blur Information Signal appears during Image QC, click it to display the blur heat map on the sample image:
Blue areas indicate relatively low blur
Red areas indicate relatively high blur
Blur Warning and Blur Heat Map
An in-focus image is ideal for downstream analysis, such as cell segmentation.
If you receive a blur warning during the Image QC step and click on it, the system displays a blur heat map:
Blue indicates areas of relatively low blur
Red indicates areas of relatively high blur
Types of Image QC
Registration QC
Confirms that the image is correctly aligned with the standard coordinate system.
Note: If Registration QC fails, the image preview on the right will not be displayed.
Image Quality QC
Evaluates whether the image was captured under appropriate conditions.
Issues in this category may lead to reduced accuracy in downstream analysis.
Last updated
Was this helpful?