> For the complete documentation index, see [llms.txt](https://help.connected.illumina.com/llms.txt). Markdown versions of documentation pages are available by appending `.md` to page URLs; this page is available as [Markdown](https://help.connected.illumina.com/dragen-stratamap/illumina-stratamap-image-tool/image-processing/review-image-qc.md).
# Review Image QC
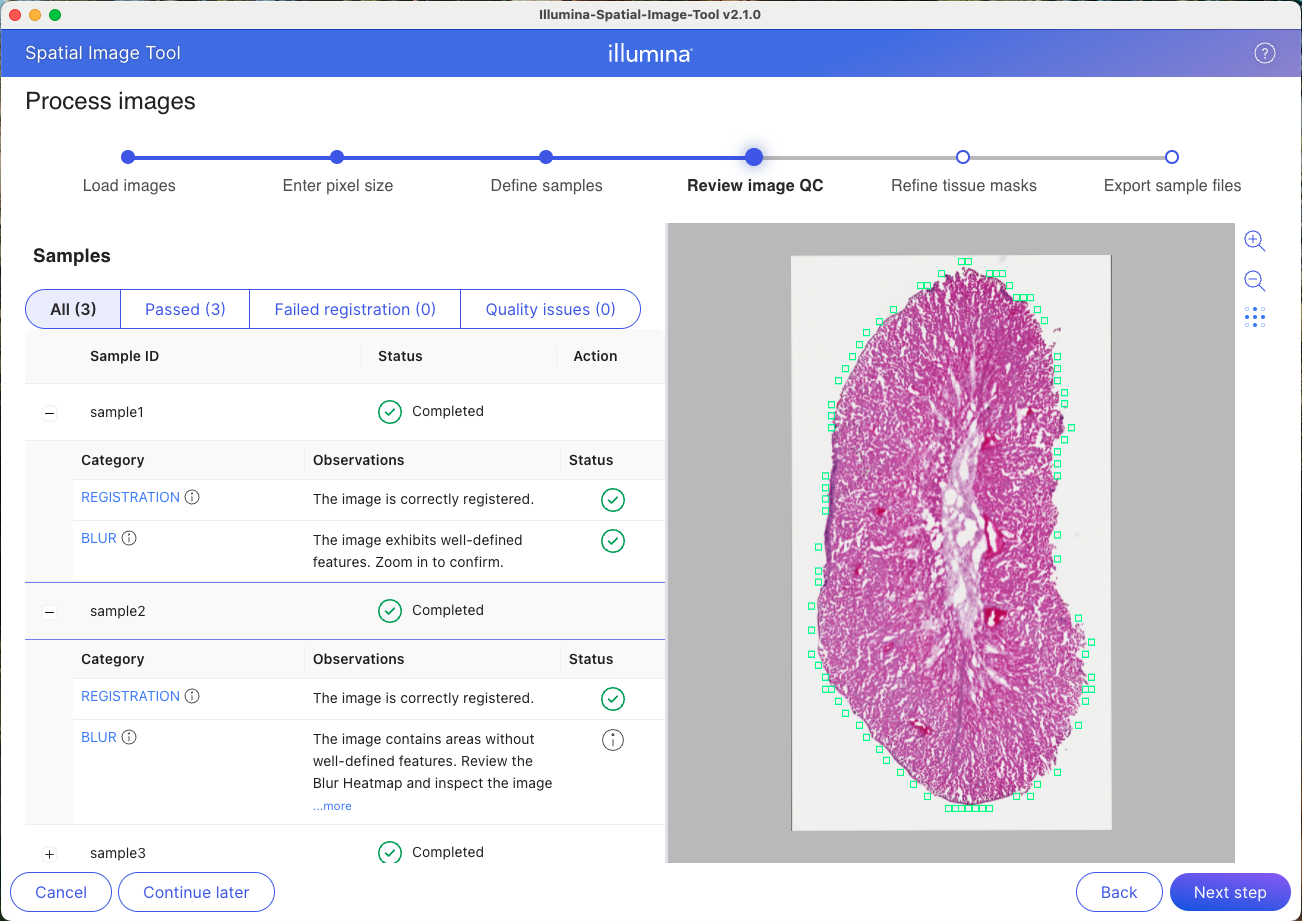
The Review image QC screen is the fourth step in the image processing workflow. It displays quality results and allows visual inspection of the images to determine whether to proceed or retake images.
The **Image QC** step evaluates uploaded images against quality and registration standards to ensure accuracy and consistency in downstream analyses.
During this process:
* Images are registered to a standard coordinate system with a resolution of 1 μm/pixel.
* Each image is transformed into an upright position aligned with the slide, based on detected fiducial markers.
* A QC status is reported, categorizing image quality and highlighting any issues that may impact analysis.
This evaluation helps identify problems early, reducing the risk of errors in subsequent steps.
{% hint style="info" %}
Confirm your image(s) pass QC before processing the samples in the assay. This allows for re-imaging if they fail registration or are not of sufficient quality. To save time, upload your stitched images into ISIT and go through the image QC step. If they pass QC, continue with the assay and return to ISIT later to complete the rest of the process through OME-TIFF export.
{% endhint %}
#### Filter Tabs
The filter tabs at the top of the samples list allow filtering by QC status:
| Tab | Description |
| ----------------------- | ------------------------------------------------ |
| **All** | Displays all samples. |
| **Passed** | Displays samples that passed all QC checks. |
| **Failed registration** | Displays samples that failed image registration. |
| **Quality issues** | Displays samples with image quality concerns. |
### QC Categories
When a sample is expanded, detailed QC results are displayed for each category:
#### **Registration**
Indicates whether the image was correctly registered. Click the information icon for more details about registration.
{% hint style="info" %}
The number and placement of fiducial markers in the QC sample image can differ between samples. Some images may show a dense grid of markers in the surrounding white area, while others may have markers mainly along the tissue edges. This variation is normal and does not indicate any error in image registration or QC status.
{% endhint %}
#### Blur
An in-focus image is ideal for downstream analysis, such as cell segmentation.
If a Blur Information Signal appears during Image QC, click it to display the blur heat map on the sample image:
* Blue areas indicate relatively low blur
* Red areas indicate relatively high blur
{% hint style="info" %}
You can proceed if blur is detected, but visually inspect image quality first. If the image appears significantly blurred and individual cells and nuclei are not visible, consider retaking the image before proceeding.
{% endhint %}
**Blur Warning and Blur Heat Map**
An in-focus image is ideal for downstream analysis, such as cell segmentation.
If you receive a blur warning during the Image QC step and click on it, the system displays a blur heat map:
* Blue indicates areas of relatively low blur
* Red indicates areas of relatively high blur
{% hint style="info" %}
While you can continue the workflow even if a blur warning appears, it is recommended to inspect the image quality first. If the image looks significantly blurred and individual cells are not visible, consider retaking the image before proceeding.
{% endhint %}
### Quality Assessment
While the software provides automated QC results, manual visual inspection is recommended. When reviewing images:
1. Zoom into the image to inspect detail.
2. Verify that nuclei are clearly visible.
3. Check for areas of blur or poor focus.
4. Use the Blur Heatmap to identify problem regions.
{% hint style="info" %}
The software QC results should be used as a tool to assist evaluation, not as the sole basis for determining image quality.
{% endhint %}
---
# Agent Instructions
This documentation is published with GitBook. GitBook is the documentation platform designed so that both humans and AI agents can read, navigate, and reason over technical content effectively. Learn more at gitbook.com.
## Querying This Documentation
If you need additional information that is not directly available in this page, you can query the documentation dynamically by asking a question.
Perform an HTTP GET request on the current page URL with the `ask` query parameter, and the optional `goal` query parameter:
```
GET https://help.connected.illumina.com/dragen-stratamap/illumina-stratamap-image-tool/image-processing/review-image-qc.md?ask=&goal=
```
`ask` is the immediate question: it should be specific, self-contained, and written in natural language.
`goal` is optional and describes the broader end goal you are ultimately trying to accomplish on behalf of the user. GitBook uses it to tailor the answer towards what is most useful for that goal.
The response will contain a direct answer to the question and relevant excerpts and sources from the documentation.
Use this mechanism when the answer is not explicitly present in the current page, you need clarification or additional context, or you want to retrieve related documentation sections.