> For the complete documentation index, see [llms.txt](https://help.connected.illumina.com/llms.txt). Markdown versions of documentation pages are available by appending `.md` to page URLs; this page is available as [Markdown](https://help.connected.illumina.com/icm/analyses/analysis-functionality/task-menu/region-analysis-1/annotate-regions.md).
# Annotate regions
ChIP-Seq and ATAC-Seq identify enriched regions or peaks in genome. Depending on the assay, the biological meaning of enrichment changes; in ChIP-Seq, enrichment indicates protein binding, while in ATAC-Seq, enrichment indicates open chromatin. To understand the importance of enriched regions in regulating gene expression, we can add information about overlapping or nearby genomic features.
#### What is Annotate regiorns?
*Annotate regions* takes an input set of regions and checks for overlap between those regions and a gene/feature annotation. This gives regulatory context for enriched regions.
#### Running Annotate regions
The input for *Annotate regions* is a Regions count type data node. This can be raw data or any filtered or normalized node containing region counts.
* Click a **Regions** data node
* Click the **Regions analysis** section in the toolbox
* Click **Annotate regions**
* Set the *Assembly* and *Annotation model*
* Set the *Genomic overlaps* parameter
The *Genomics overlaps* parameter lets you choose one of two options (Figure 1).
* *Report one gene region per genomic feature (precedence applies)* chooses one gene section for each region using the precedence order to settle cases where more than one gene section overlaps a peak. The order of precedence is TSS, TTS, CDS Exon, 5' UTR Exon, 3' UTR Exon, Intron, Intergenic.
* *Report all gene regions per feature* creates a row for each gene section that overlaps a region in the task report.
Figure 1. Annotate regions task setup page.
* User should define the transcription start site (TSS) and transcription termination site (TTS) limit in the unit of bp
* Click **Finish** to run
#### Annotate regions output
Annotate regions produces an *Annotated regions* data node. The *Annotated regions* task report adds a *Gene section breakdown* pie chart and adds columns with information about the *Gene ID*s, *Transcript ID*s, *Gene section*, *Distance to TSS*, and *Distance to TTS* of each region to the standard Regions report (Figure 2). If run with the option to report all gene sections selected, each region will have a row for each gene section it overlaps. If run with the option to report one gene section selected, each region will have one row with the gene section it overlaps chosen using the order of precedence.
Figure 2. Annotated regions report.
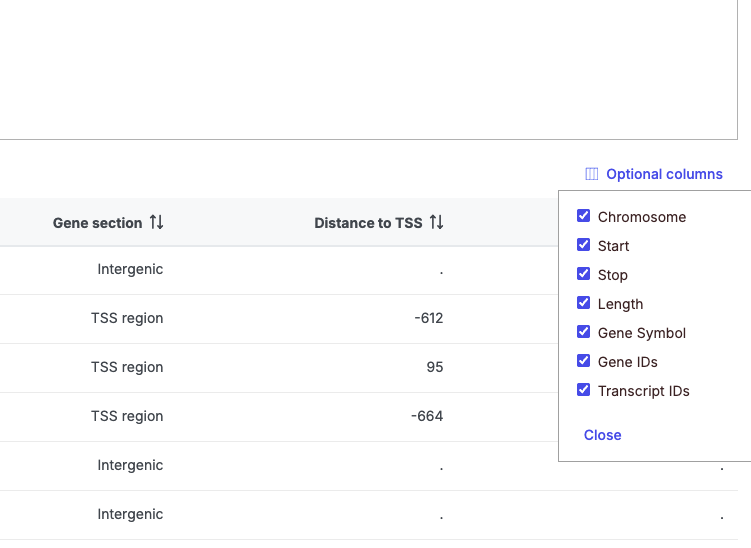
The table can be sorted by any of its columns (Figure 3). Click on the *Optional columns* on the upper-left corner of the table to add more information on each region
Figure 3. Optional columns in the report table, click the arrows next to the column header to sort it.
**Gene sections**
**TSS**
Transcription start site (TSS) is -1000bp and +100bp (default setting) from the TSS for a transcript
**TTS**
Transcription termination site (TTS) is -100bp and +1000bp (default setting) from the TTS for a transcript
**CDS Exon**
Coding sequence (CDS) Exon is overlapping a coding exon in a transcript
**5' UTR Exon**
5' Untranslated Region (UTR) Exon is overlapping an exon in the 5' UTR of a transcript
**3' UTR Exon**
3' Untranslated Region (UTR) Exon is overlapping an exon in the 3' UTR of a transcript
**Intron**
Intron is overlapping an intron in a transcript
**Intergenic**
Intergenic is not located within 1000bp of a transcript
###
---
# Agent Instructions
This documentation is published with GitBook. GitBook is the documentation platform designed so that both humans and AI agents can read, navigate, and reason over technical content effectively. Learn more at gitbook.com.
## Querying This Documentation
If you need additional information that is not directly available in this page, you can query the documentation dynamically by asking a question.
Perform an HTTP GET request on the current page URL with the `ask` query parameter, and the optional `goal` query parameter:
```
GET https://help.connected.illumina.com/icm/analyses/analysis-functionality/task-menu/region-analysis-1/annotate-regions.md?ask=&goal=
```
`ask` is the immediate question: it should be specific, self-contained, and written in natural language.
`goal` is optional and describes the broader end goal you are ultimately trying to accomplish on behalf of the user. GitBook uses it to tailor the answer towards what is most useful for that goal.
The response will contain a direct answer to the question and relevant excerpts and sources from the documentation.
Use this mechanism when the answer is not explicitly present in the current page, you need clarification or additional context, or you want to retrieve related documentation sections.
.png?alt=media)
.png?alt=media)