> For the complete documentation index, see [llms.txt](https://help.connected.illumina.com/llms.txt). Markdown versions of documentation pages are available by appending `.md` to page URLs; this page is available as [Markdown](https://help.connected.illumina.com/illumina-trupath-genome/data-visualizations-and-analysis/visualize-data-in-platform-core.md).
# Visualize Data in Platform Core
This page describes how to use the Genome Viewer to visualize TruPath Outputs in Platform Core.
The Genome Viewer in Illumina BioInsight Platform Core is an interactive, browser-based genome browser for exploring the outputs of a DRAGEN Germline TruPath analysis. It displays aligned reads, variant calls, phasing, structural variants, and genome-wide proximity information as a set of stacked, coordinate-linked tracks, allowing a move from a whole-genome overview down to individual bases in a single view.
This guide describes how to open the Genome Viewer, how to navigate it, and what each track shows and when to use it.
### **Genome Viewer Overview**
The Genome Viewer brings the key outputs of a DRAGEN Germline (TruPath) analysis together into a single, interactive visual context, removing the need to open VCFs, BAMs, and proximity files in separate tools to understand a result. Instead of appearing as rows of text, variant calls are shown laid over the reference and gene annotations, alongside the reads that support them and the phasing that connects them.
**What the visualizations do**
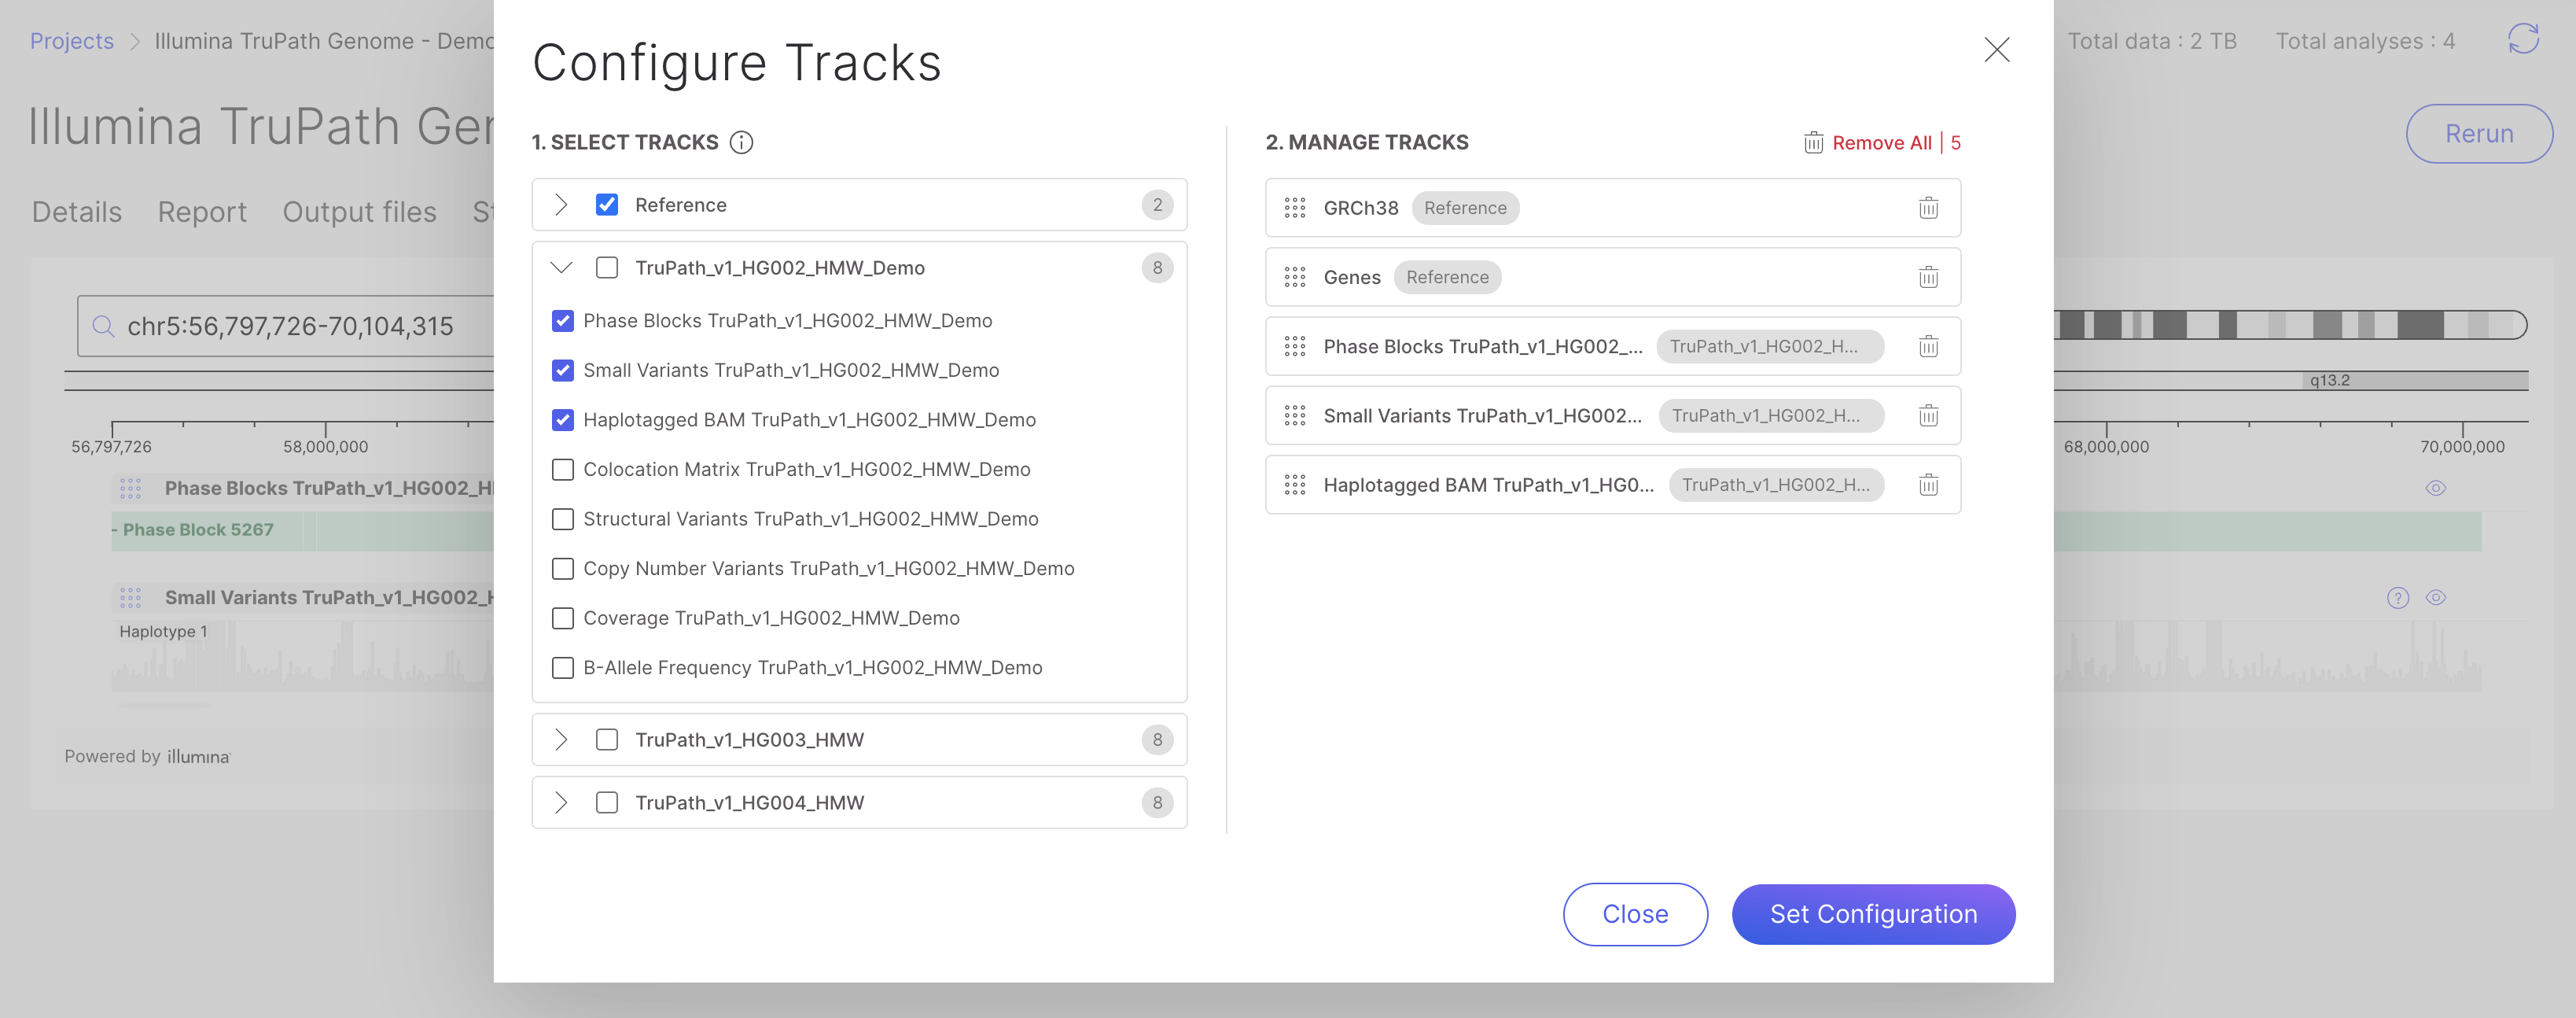
* **Unify the evidence.** Reads, small variants, phasing, structural variants, copy number, and genome-wide proximity are shown as coordinate-linked tracks that scroll and zoom together, so every piece of evidence for a locus lines up in one place.
* **Make calls verifiable.** The reads underneath a variant can be inspected directly to confirm it is real and well-supported, rather than trusting a call in isolation.
* **Expose relationships that tables hide.** Phase blocks show which variants are inherited together; the colocation (Hi-C) map reveals long-range contacts that support structural rearrangements; SV break-ends link to their mate location.
* **Handle the hard regions.** Dedicated tracks allow inspection of variant calls in paralogous, segmentally duplicated regions that conventional alignment-based views cannot resolve reliably.
### **What it's intended for**
The viewer is aimed at researchers and clinicians reviewing a sample's results—triaging and confirming variants of interest, interpreting them in genomic and clinical context, resolving compound heterozygosity through phasing, and investigating structural and copy number changes—without needing a separate genome-browser setup or command-line tooling.
**The benefit**
* **Faster interpretation** — everything needed to assess a locus is in one view, reducing tool-switching and manual cross-referencing.
* **Higher confidence** — decisions are backed by the visible read-level and phasing evidence, not just a summary value.
* **Accessible in-platform** — the viewer runs directly on Platform Core analysis outputs, so results are explorable by the whole team without extra downloads, conversions, or local installs.
* **Better coverage of difficult genes** — phasing, proximity, and MRJD visualizations extend confident review into regions that are clinically important but historically hard to interpret.
### **What it's not intended for**
The Genome Viewer is a **general visualizer for exploring data and confirming evidence**—for example, opening BAM files to check the read support behind a variant. It is deliberately scoped to that role, and the following uses are out of scope:
* **Not an interpretation tool.** The Genome Viewer does not classify, prioritize, annotate, or assign clinical significance to variants. It shows the underlying evidence; it does not draw conclusions from it. For interpretation of TruPath outputs, please navigate to [Emedgene](https://help.connected.illumina.com/emedgene/).
* **Not a reporting system.** It does not generate clinical reports, sign-out documents, or curated variant lists, and is **not a substitute for any interpretation or reporting system**. For reporting on TruPath variants, please navigate to [Emedgene](https://help.connected.illumina.com/emedgene/).
* **Not a primary or secondary analysis tool.** It does not perform alignment, variant calling, or filtering. It displays outputs that DRAGEN has already produced; it does not create or modify calls. For more information on DRAGEN, please navigate to our [DRAGEN User Guide.](https://help.connected.illumina.com/dragen/dragen-v4.5/product-guides/dragen-v4.5/dragen-trupath-pipeline)
* **Not a decision-making system of record.** Findings confirmed visually still need to be interpreted, curated, and reported in the appropriate dedicated system before they inform any clinical decision.
In short: the Genome Viewer is positioned for **data exploration and confirmatory evidence**, not for interpretation, reporting, or clinical decision-making.
### Navigate the viewer
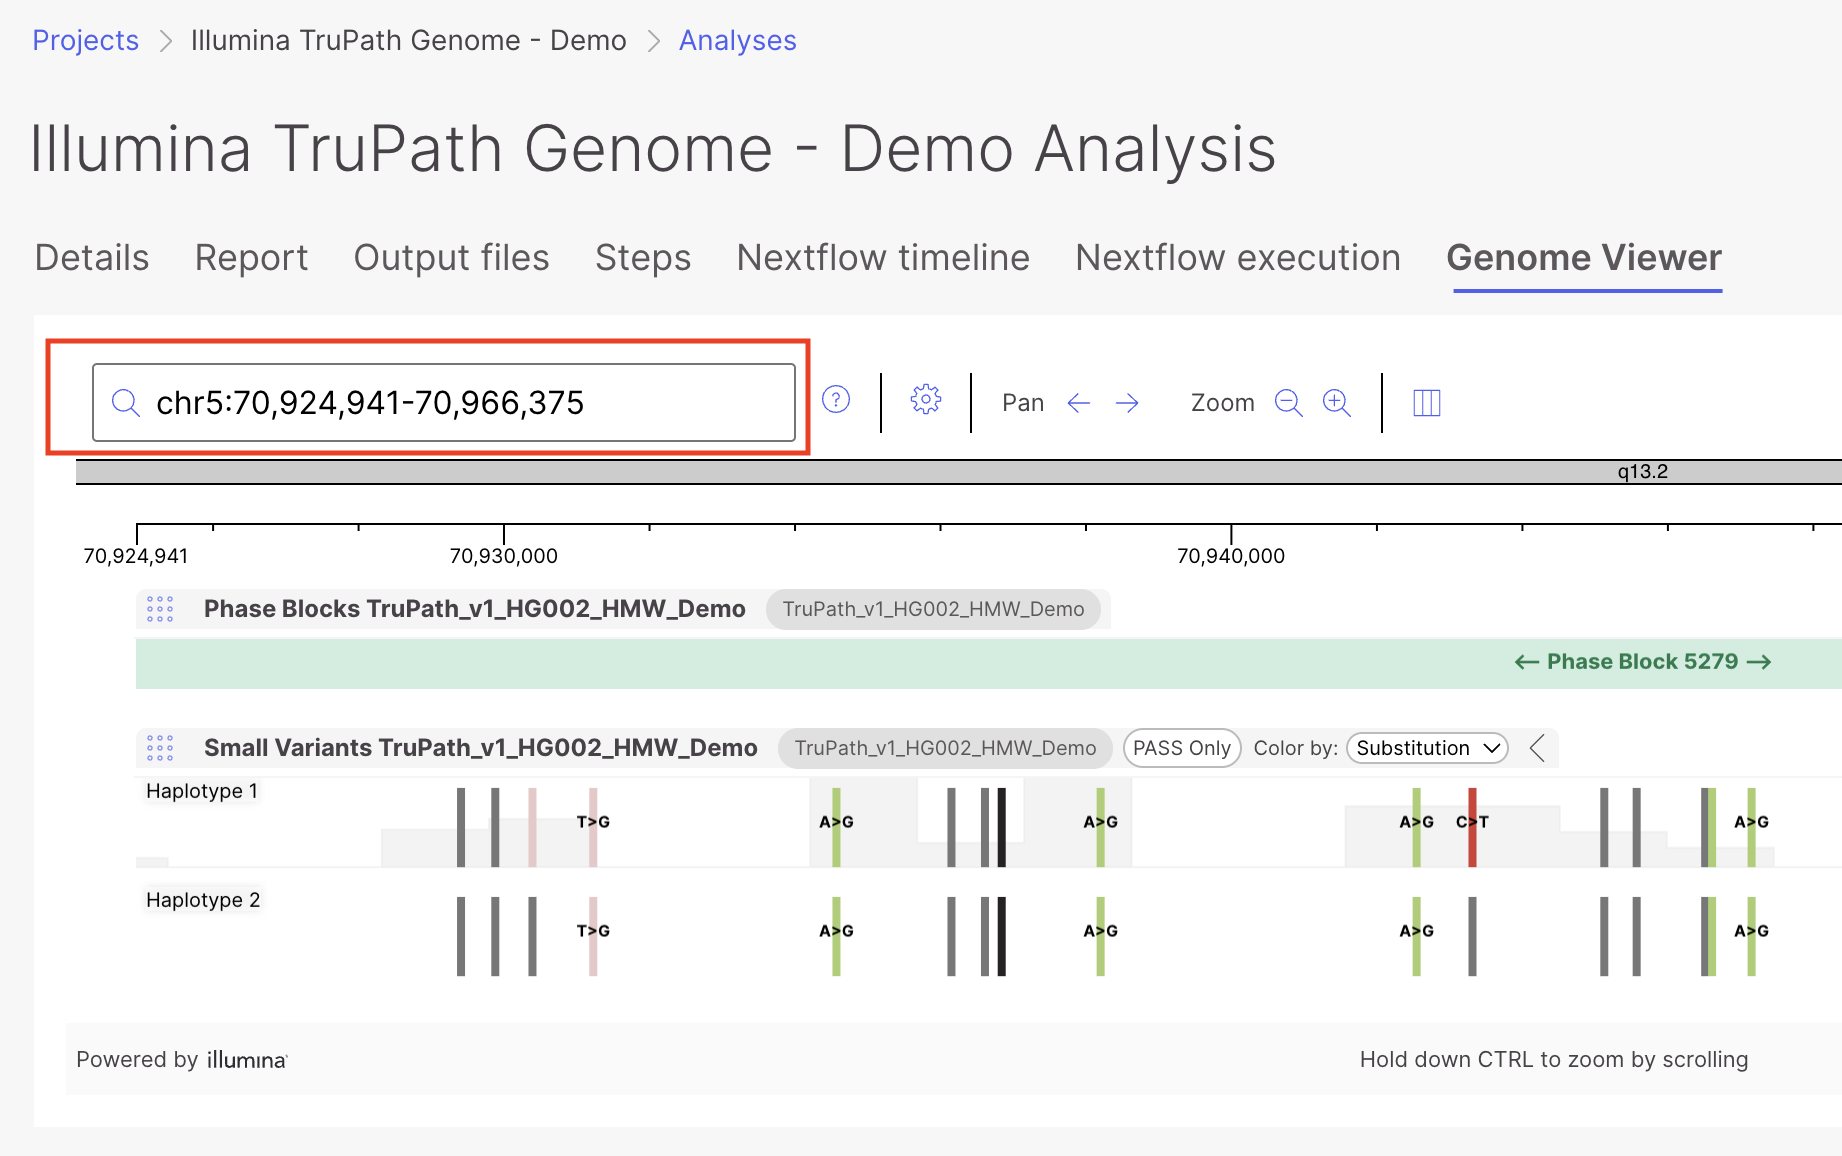
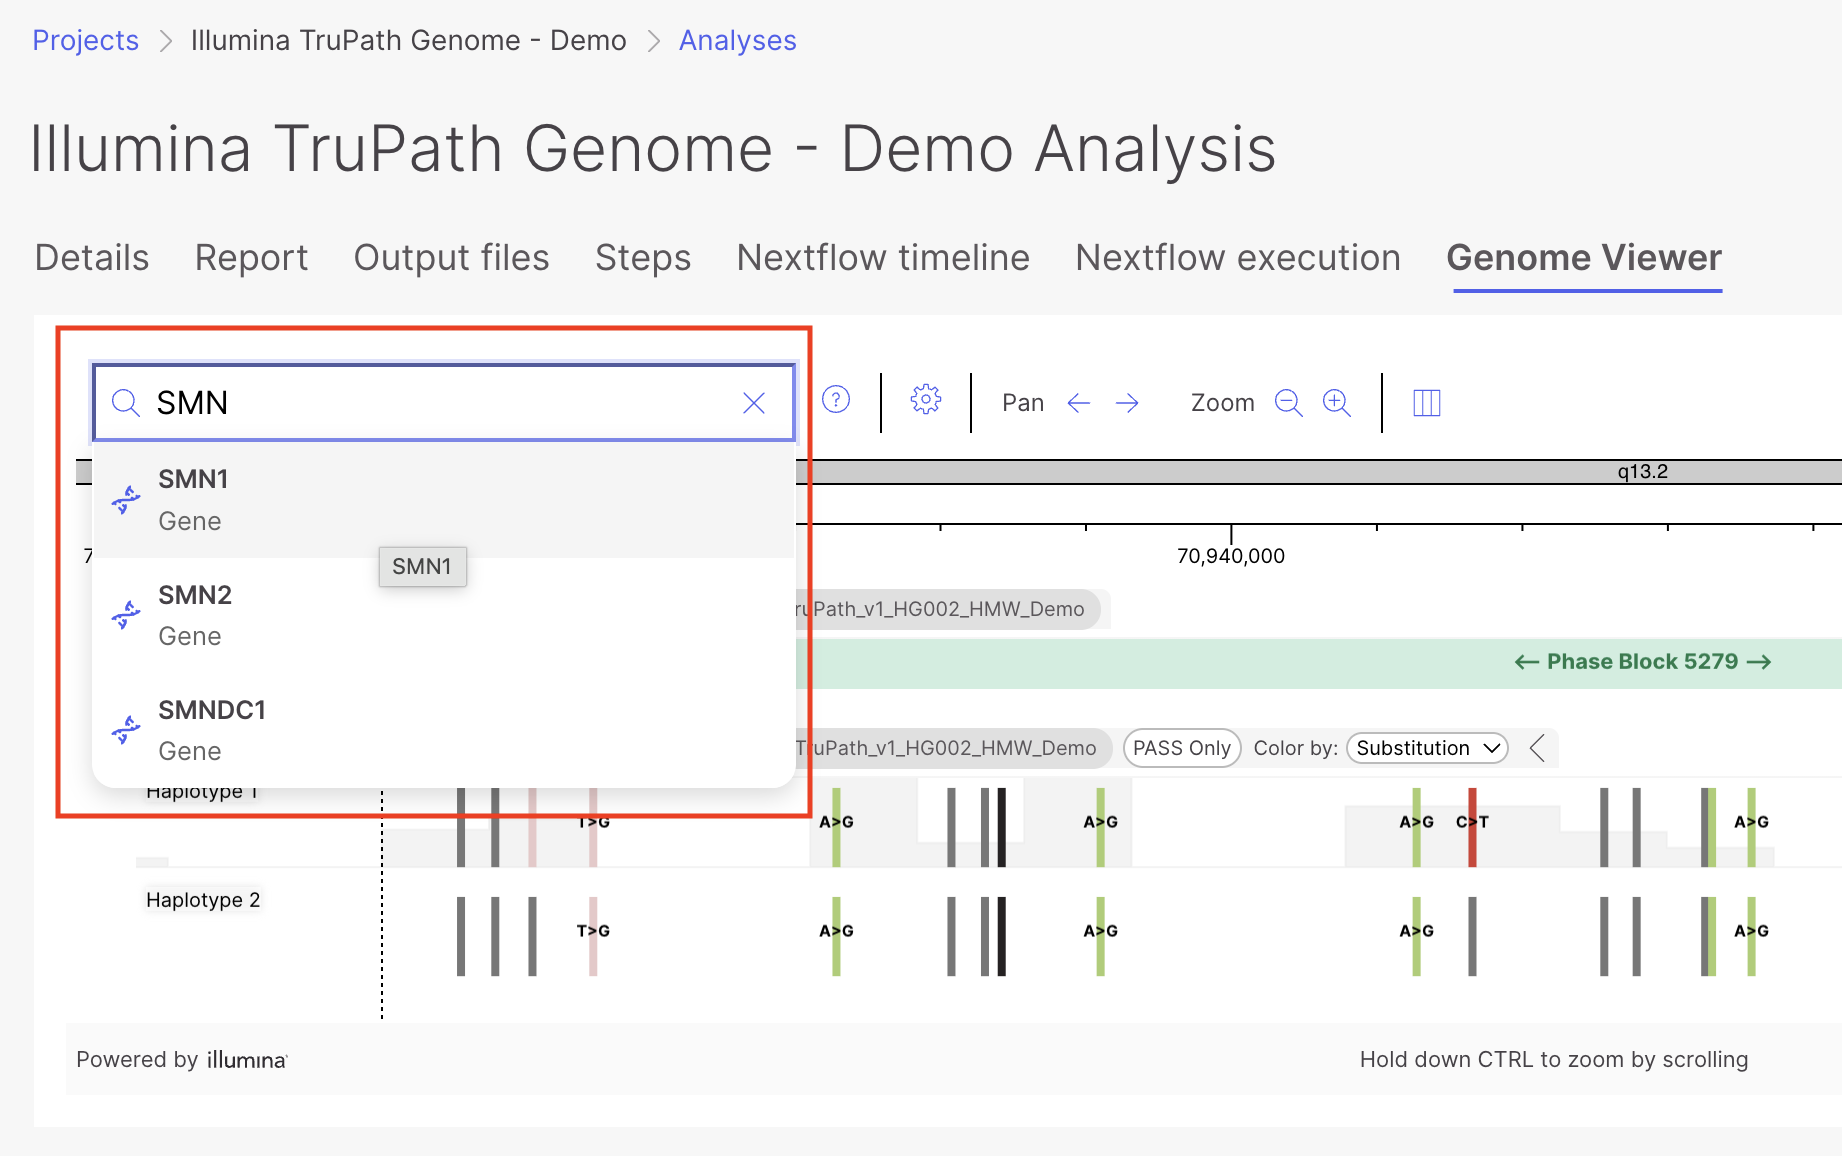
* **Search box** — Enter a gene name (for example, `SMN1`, `PMS2`, `CYP21A2`) or genomic coordinates (for example, `chr5:70924941-70966375`) to jump directly to a region. Gene-name search resolves the gene from the RefSeq annotation and centers the view on it.
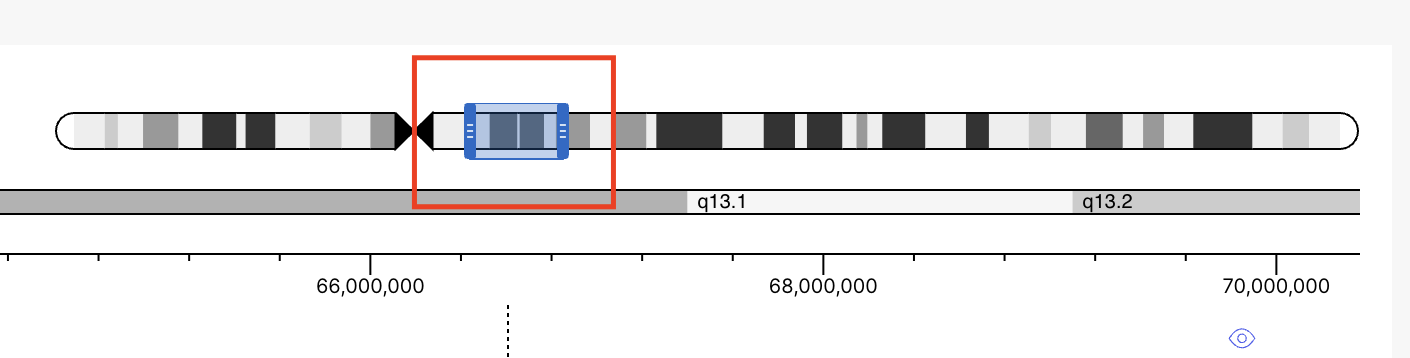
* **Zoom** — Zoom from the whole-chromosome/ideogram level down to base-pair resolution. Track detail increases at higher zoom; for example, read sequence and base-level mismatches only become visible at high zoom.
* **Pan** — Drag horizontally to move along the chromosome while holding the current zoom level.
* **Track groups** — Tracks for a given sample share a track group, so navigation stays synchronized across that sample's reads, variants, and phasing.
### Track reference
For each track below: **What it shows** describes the displayed data, and **When to use it** gives practical use cases.
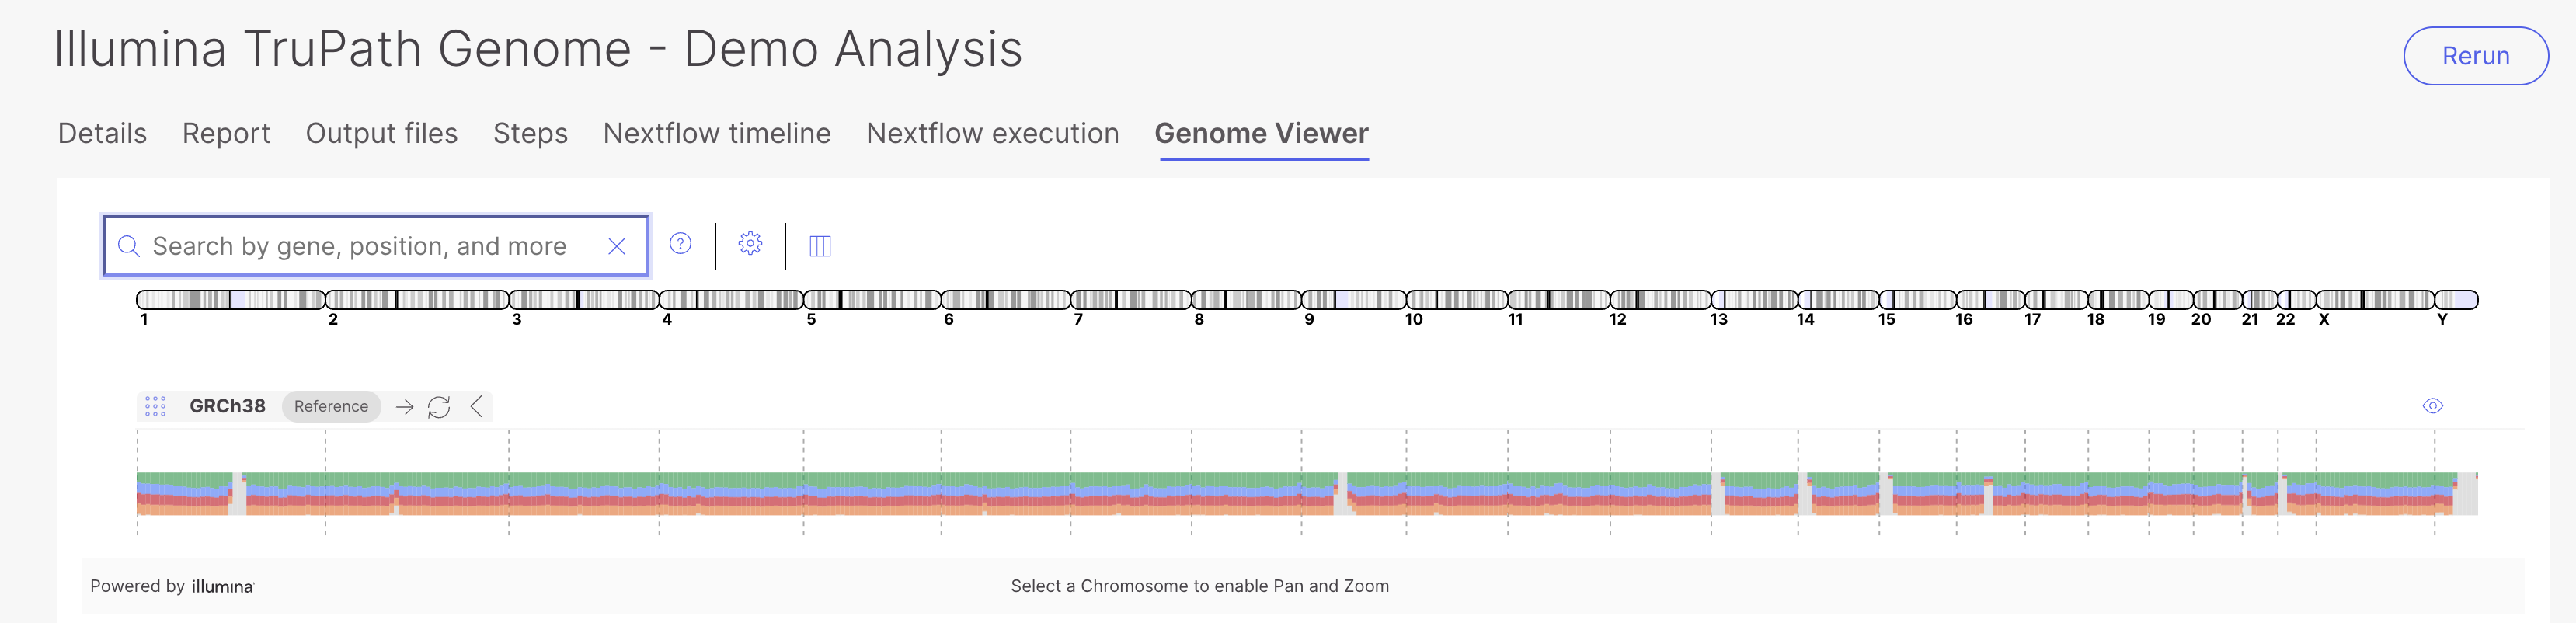
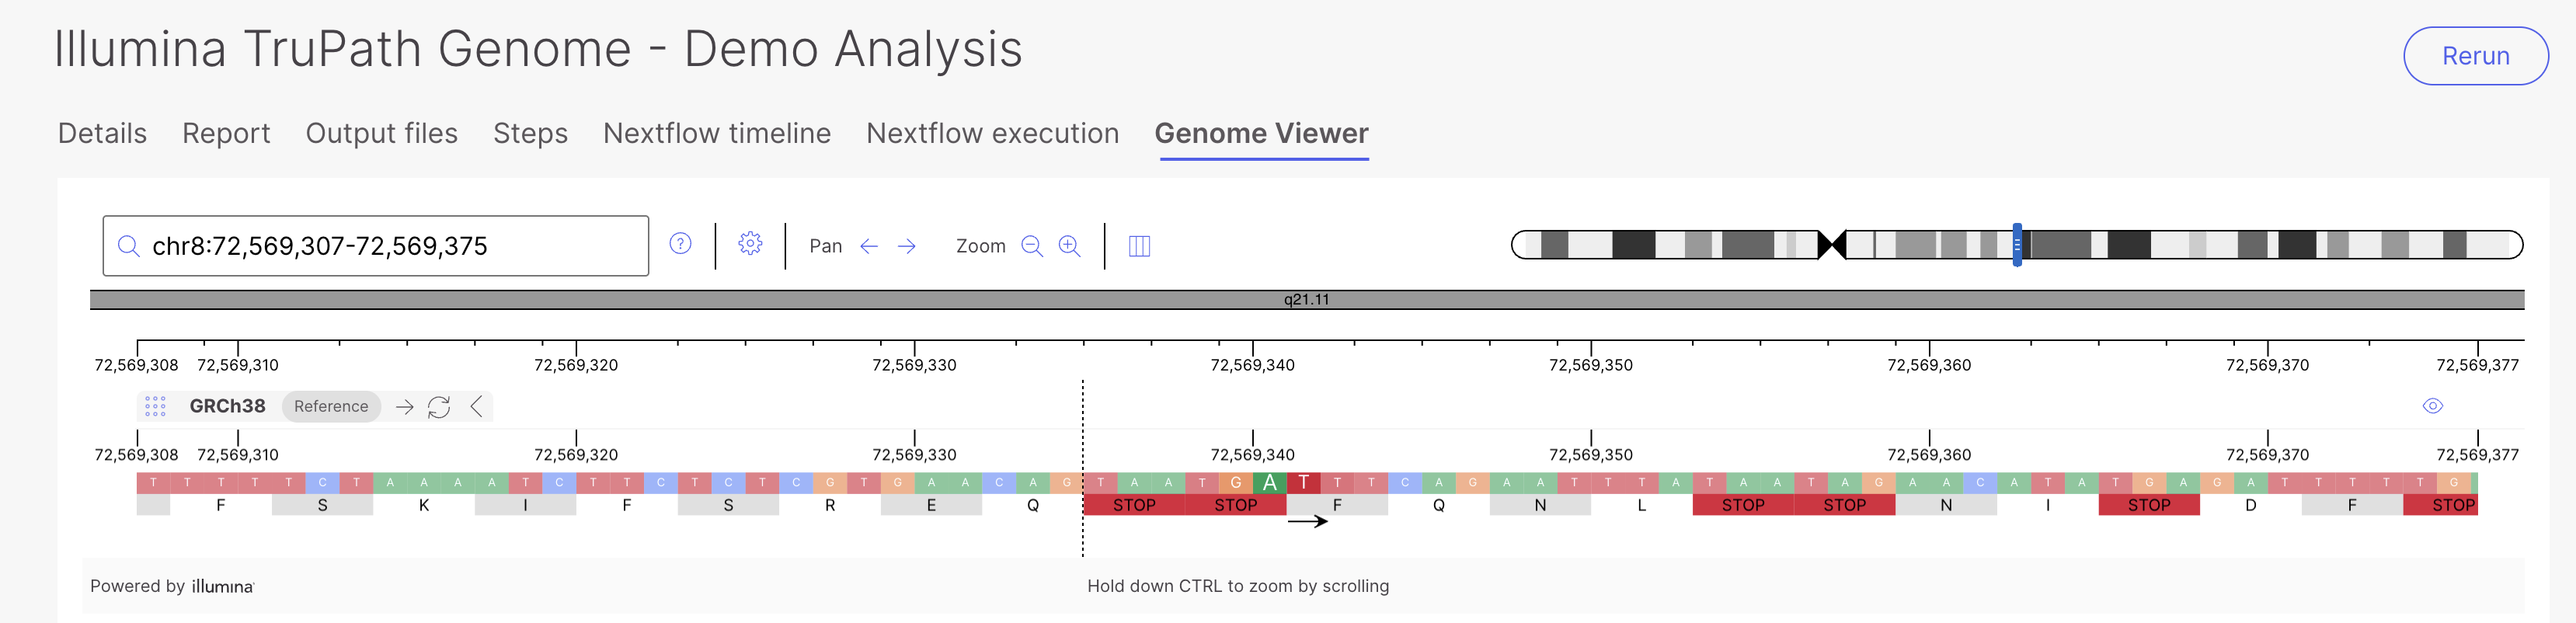
#### Reference Track (GRCh38)
* **What it shows:** The reference genome sequence. At high zoom the individual reference bases (and amino acid translation) are shown; at low zoom it acts as the coordinate backbone for every other track.
* **When to use it:** Interpreting a variant against the expected reference base, checking reading frame, and confirming genomic context for a call.
Reference track showing whole genome view (top) and showing bases and amino acid translation at high zoom (bottom):
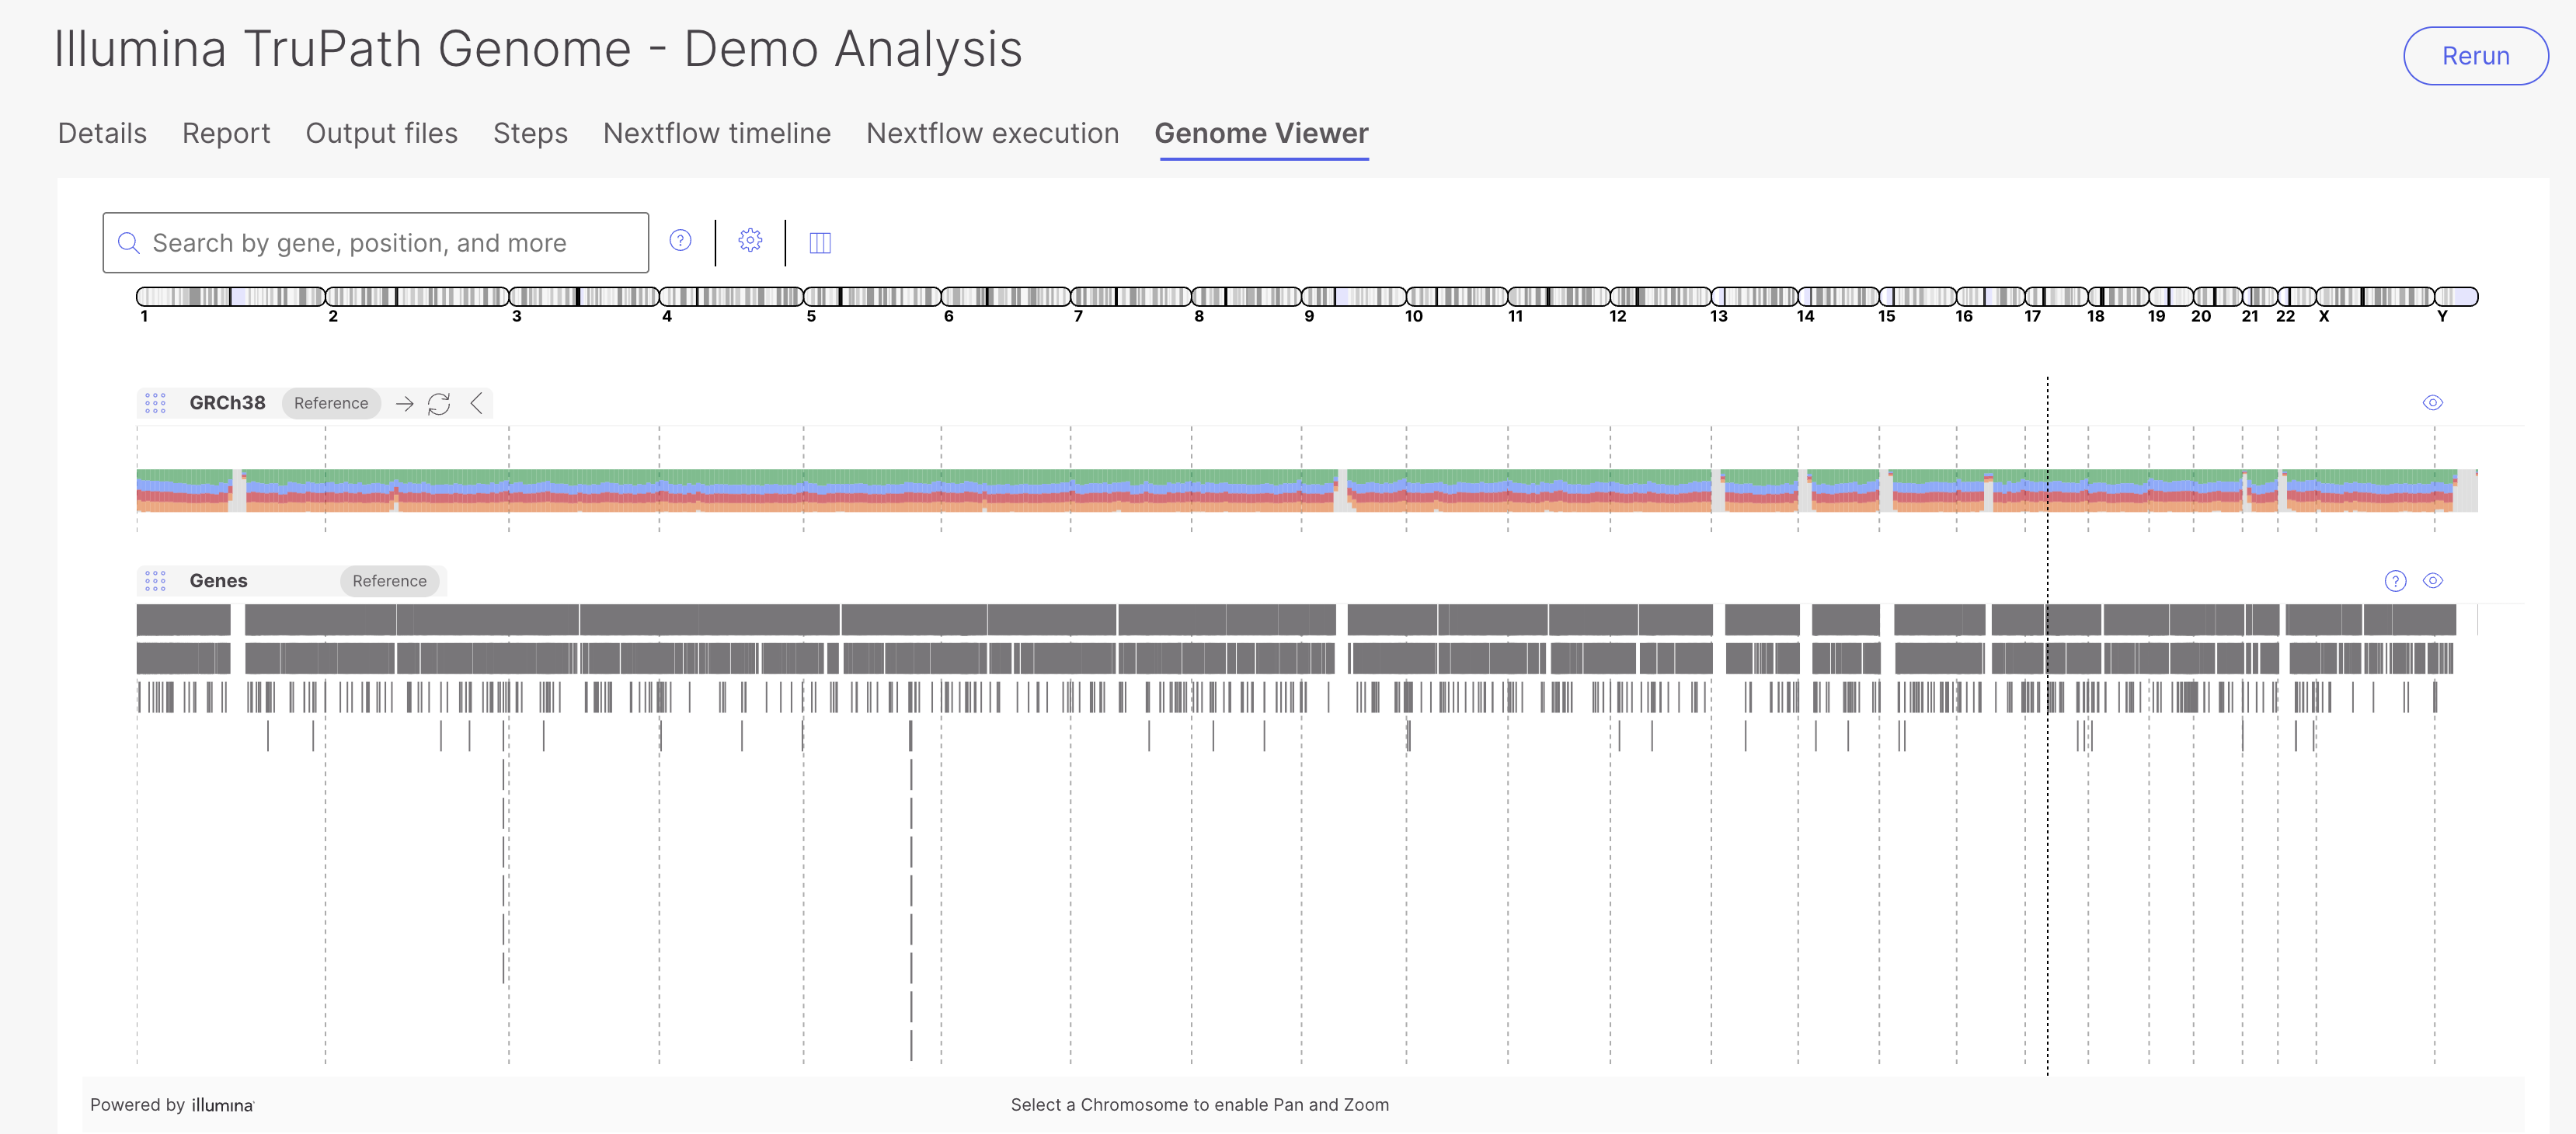
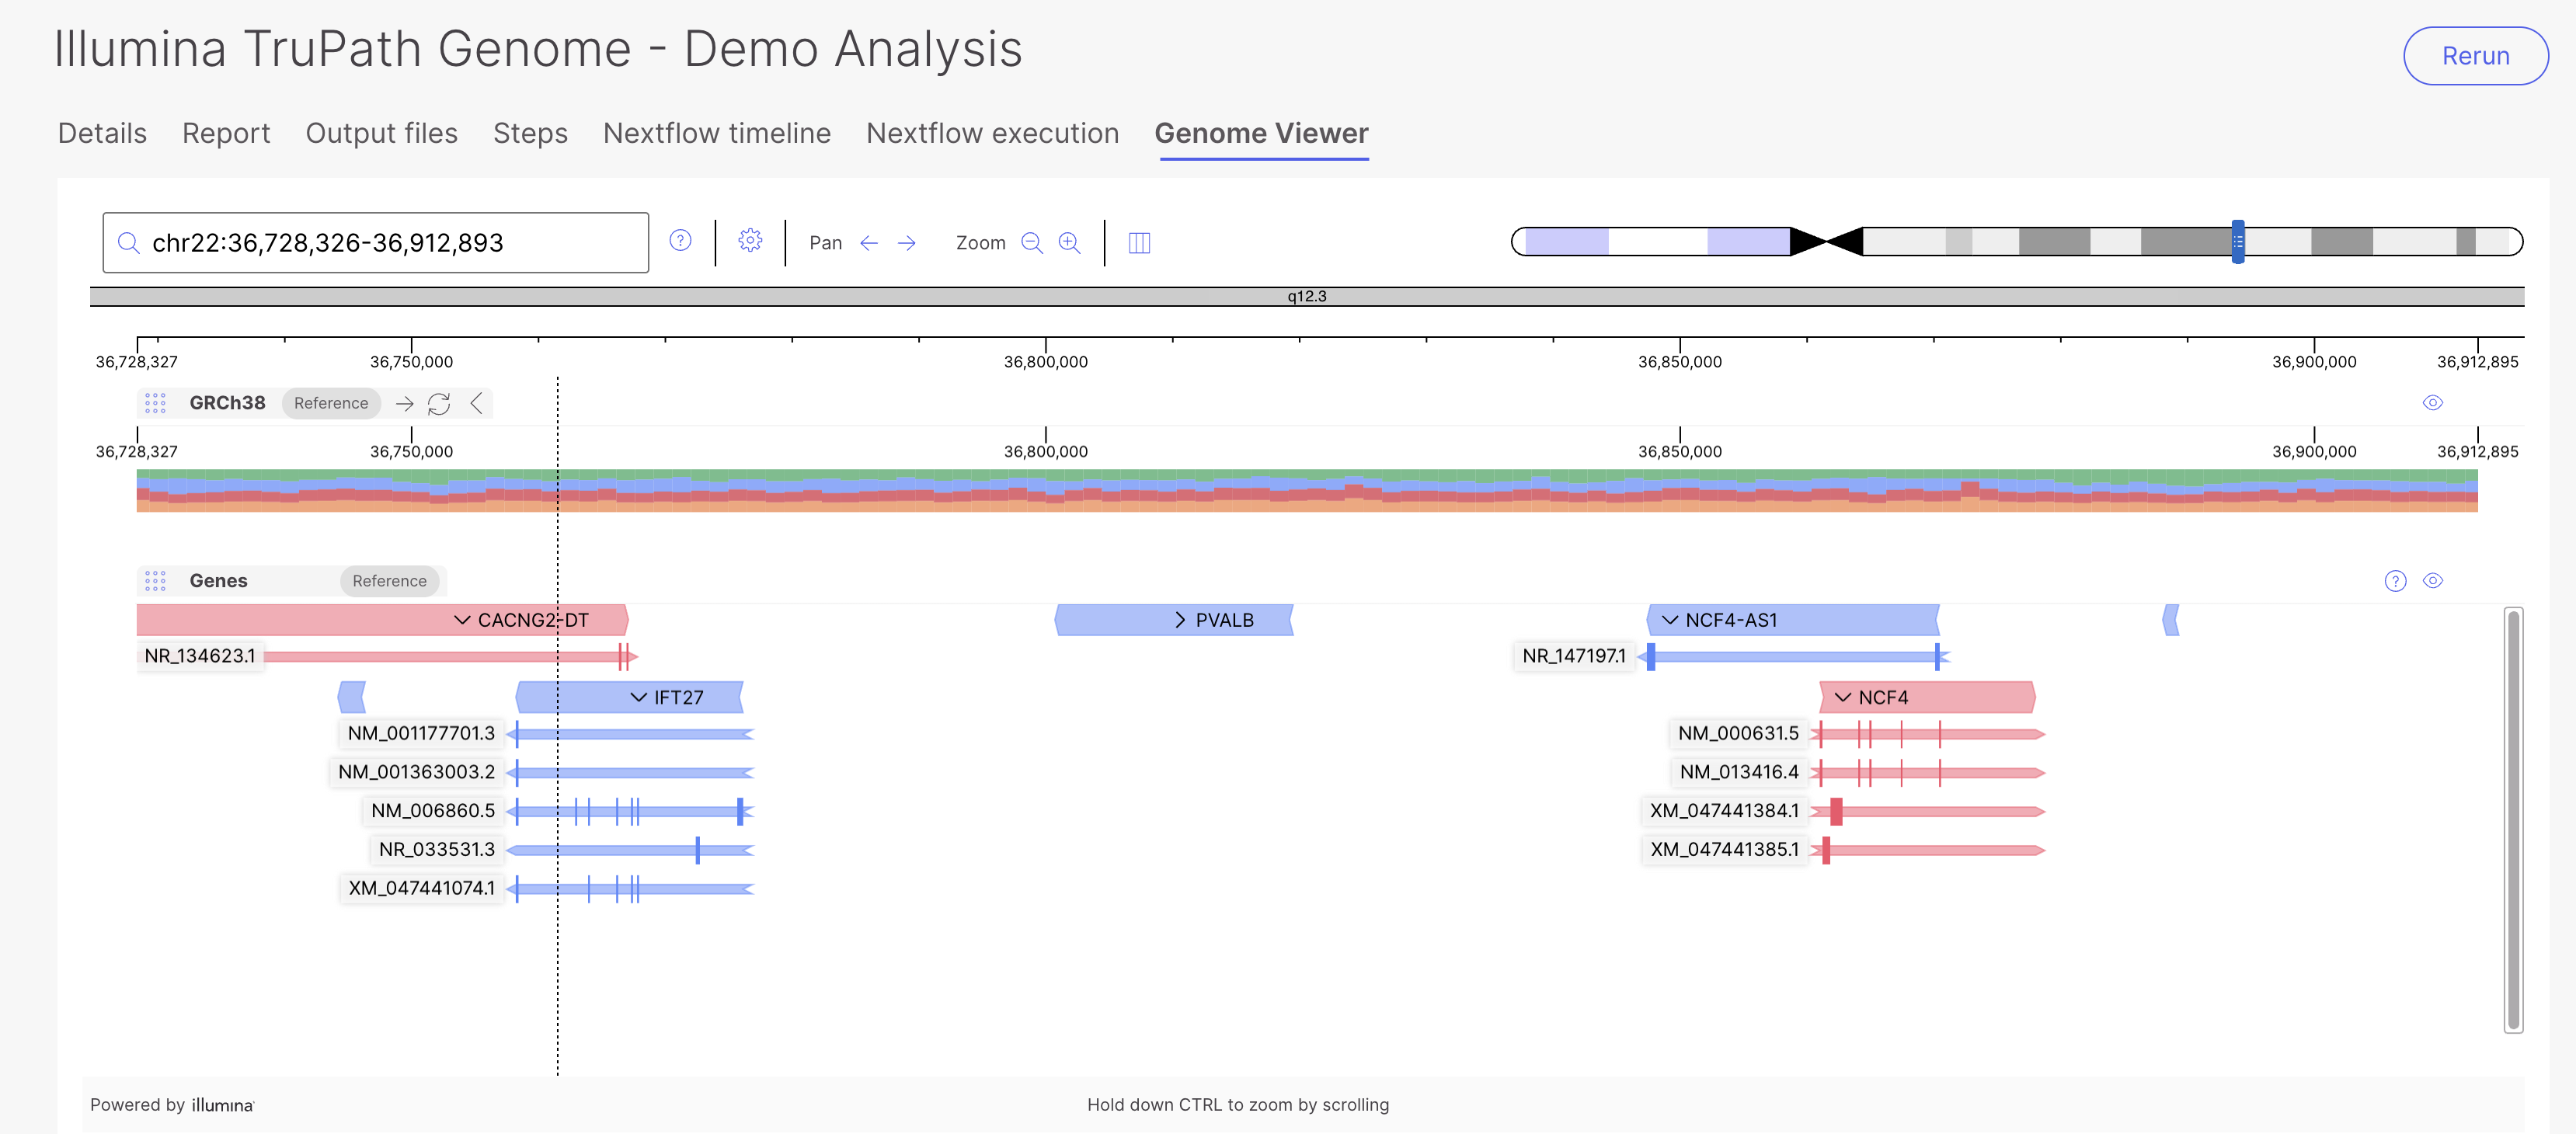
#### Gene Track
* **What it shows:** RefSeq gene annotations, including transcripts, exons, and coding sequence (CDS).
* **When to use it:** Locating a variant within a gene, determining whether it falls in an exon, intron, or coding region, and orienting yourself before inspecting reads or variants.
Gene track showing a transcript with exons and CDS:
#### Haplotagged BAM Track
* **What it shows:** Aligned sequencing reads (the sample `.bam`), including coverage, base mismatches, mate-pair relationships, and clipping. Reads can be colored and grouped by **Haplotype** (default), or by **Read Strand**, **First-of-Pair**, or **Pair Orientation**, and grouped **by None** as alternatives.
* **When to use it:** Confirming that a variant is supported by the underlying reads, assessing read depth and quality, inspecting phasing at the read level, and investigating potential artifacts (for example, misalignment or soft-clipping around a breakpoint).
Haplotagged BAM track at the whole genome view (left) and zoomed in with reads colored and grouped by haplotype (right):
#### Small Variants (Phased SNP) Track
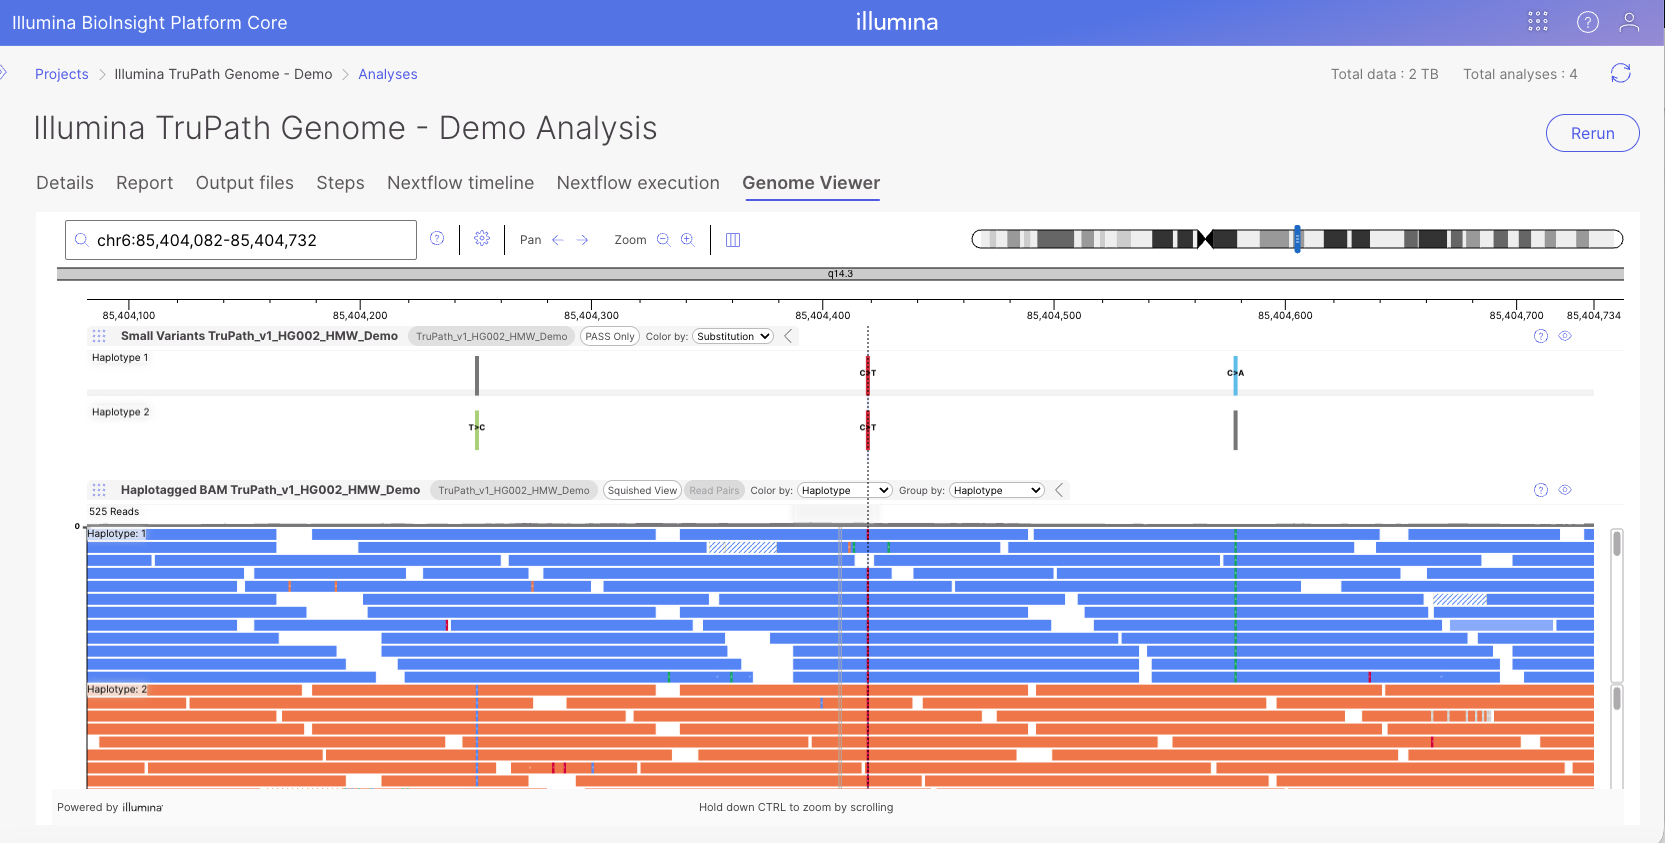
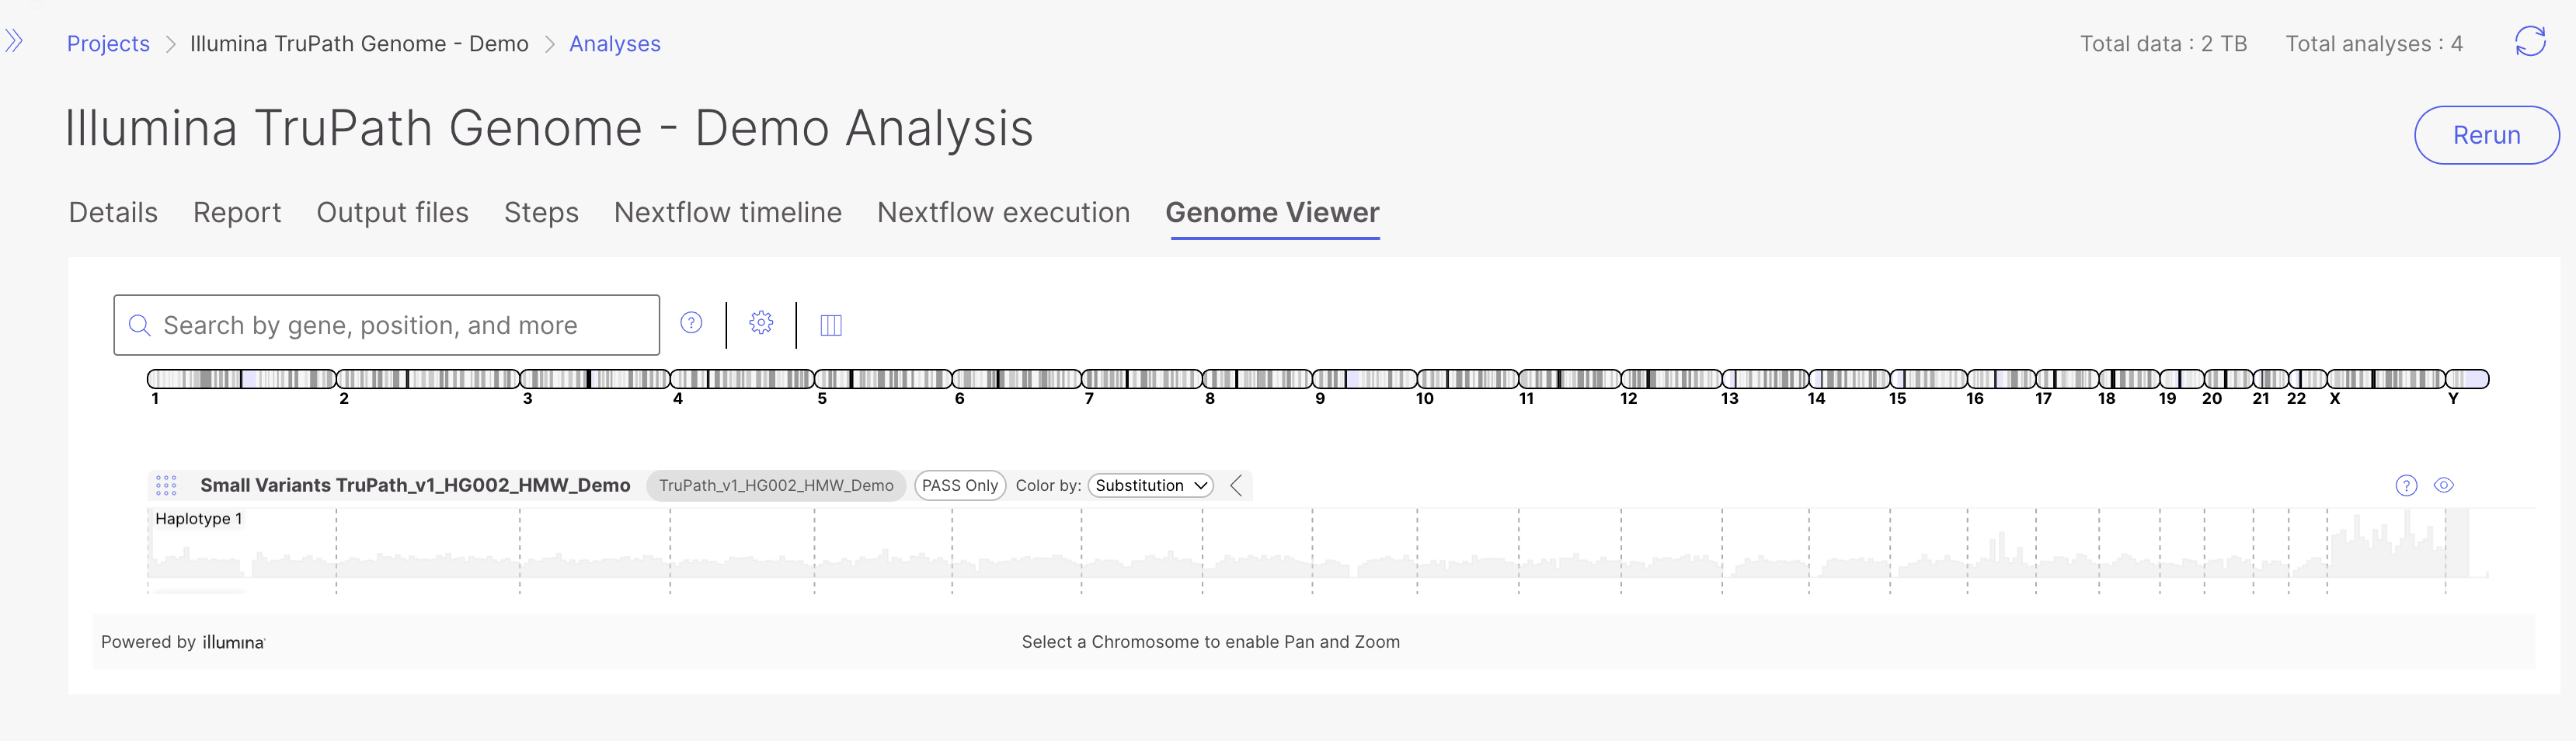
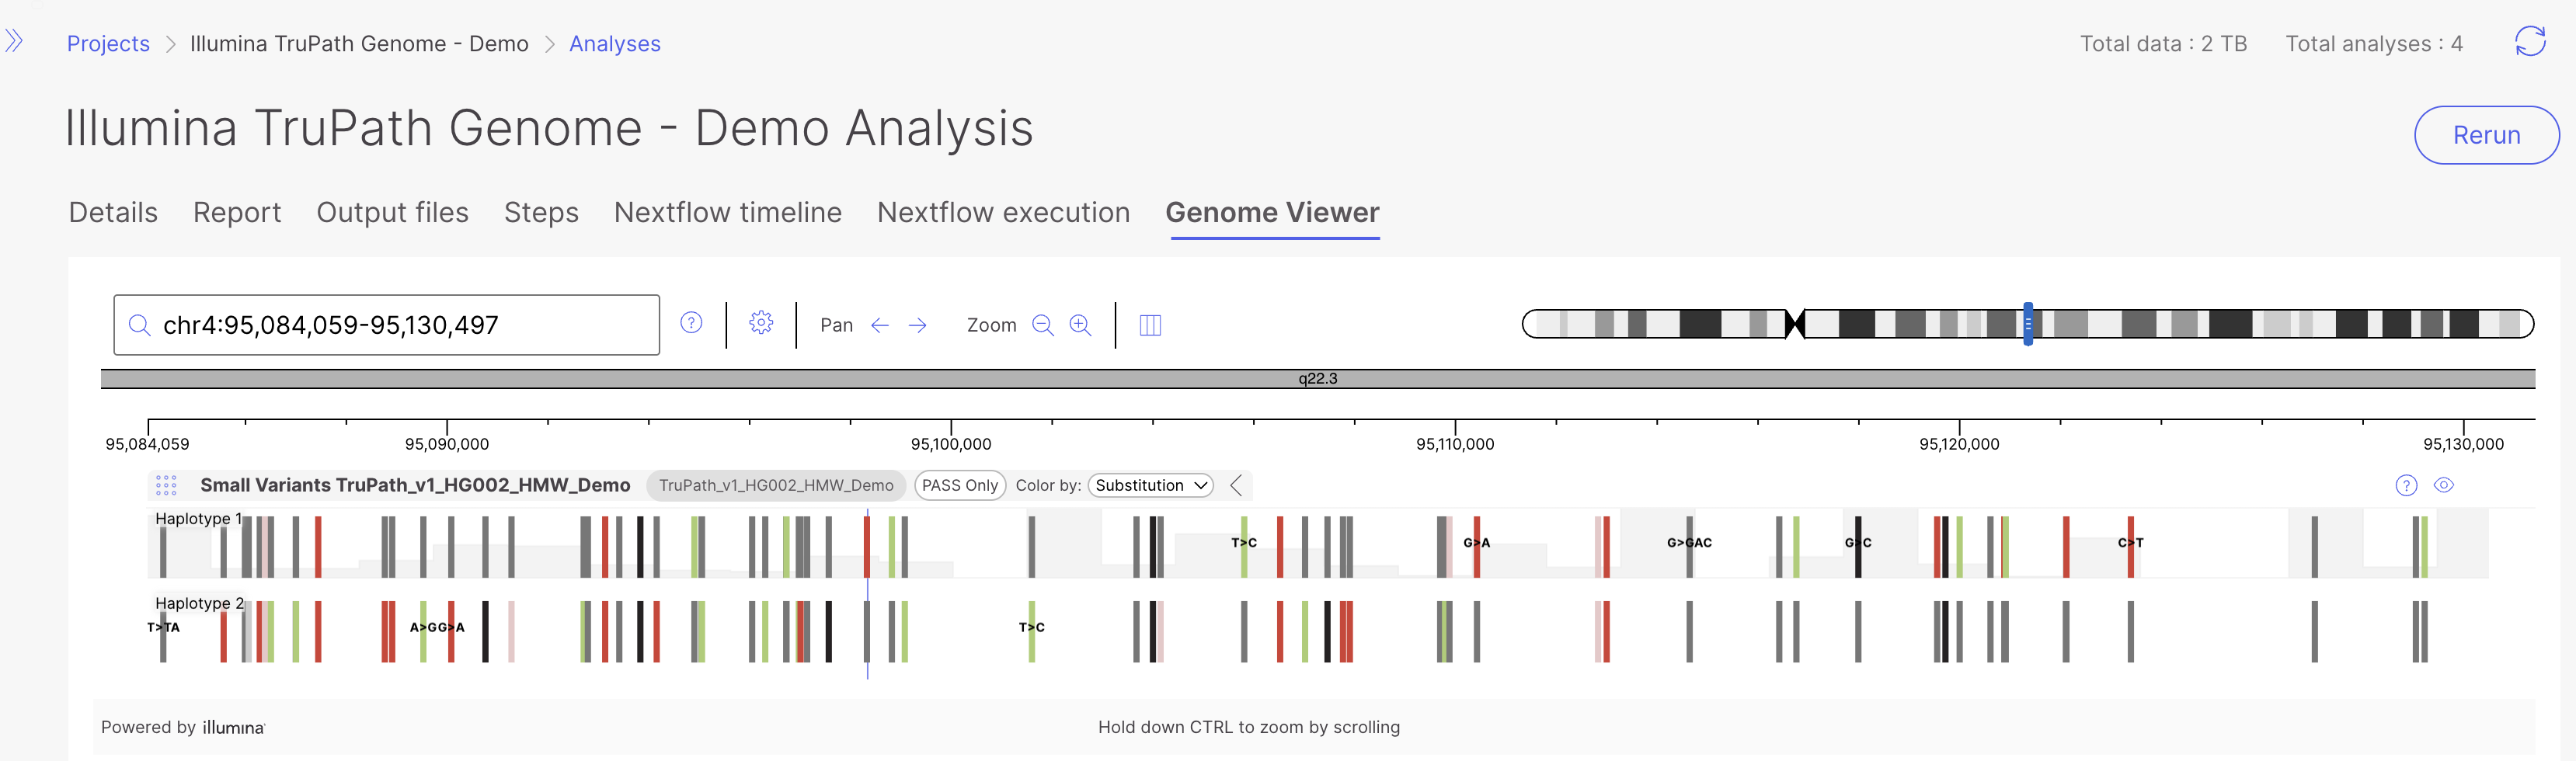
* **What it shows:** Small variants (SNVs and indels) from the `.hard-filtered.vcf.gz`, split by **Haplotype 1** and **Haplotype 2** so phased calls are visually separated. Variants can be colored by **Substitution** or **Variant Type**, and a **PASS Only** filter is available to hide non-PASS calls.
* **When to use it:** Reviewing called variants, distinguishing which haplotype carries each allele, and resolving **compound heterozygosity** by seeing whether two variants sit on the same or opposite haplotypes.
Small Variants Track at the whole genome view (top), and zoomed in split by Haplotype 1 and Haplotype 2 (bottom):
#### Phase Blocks Track
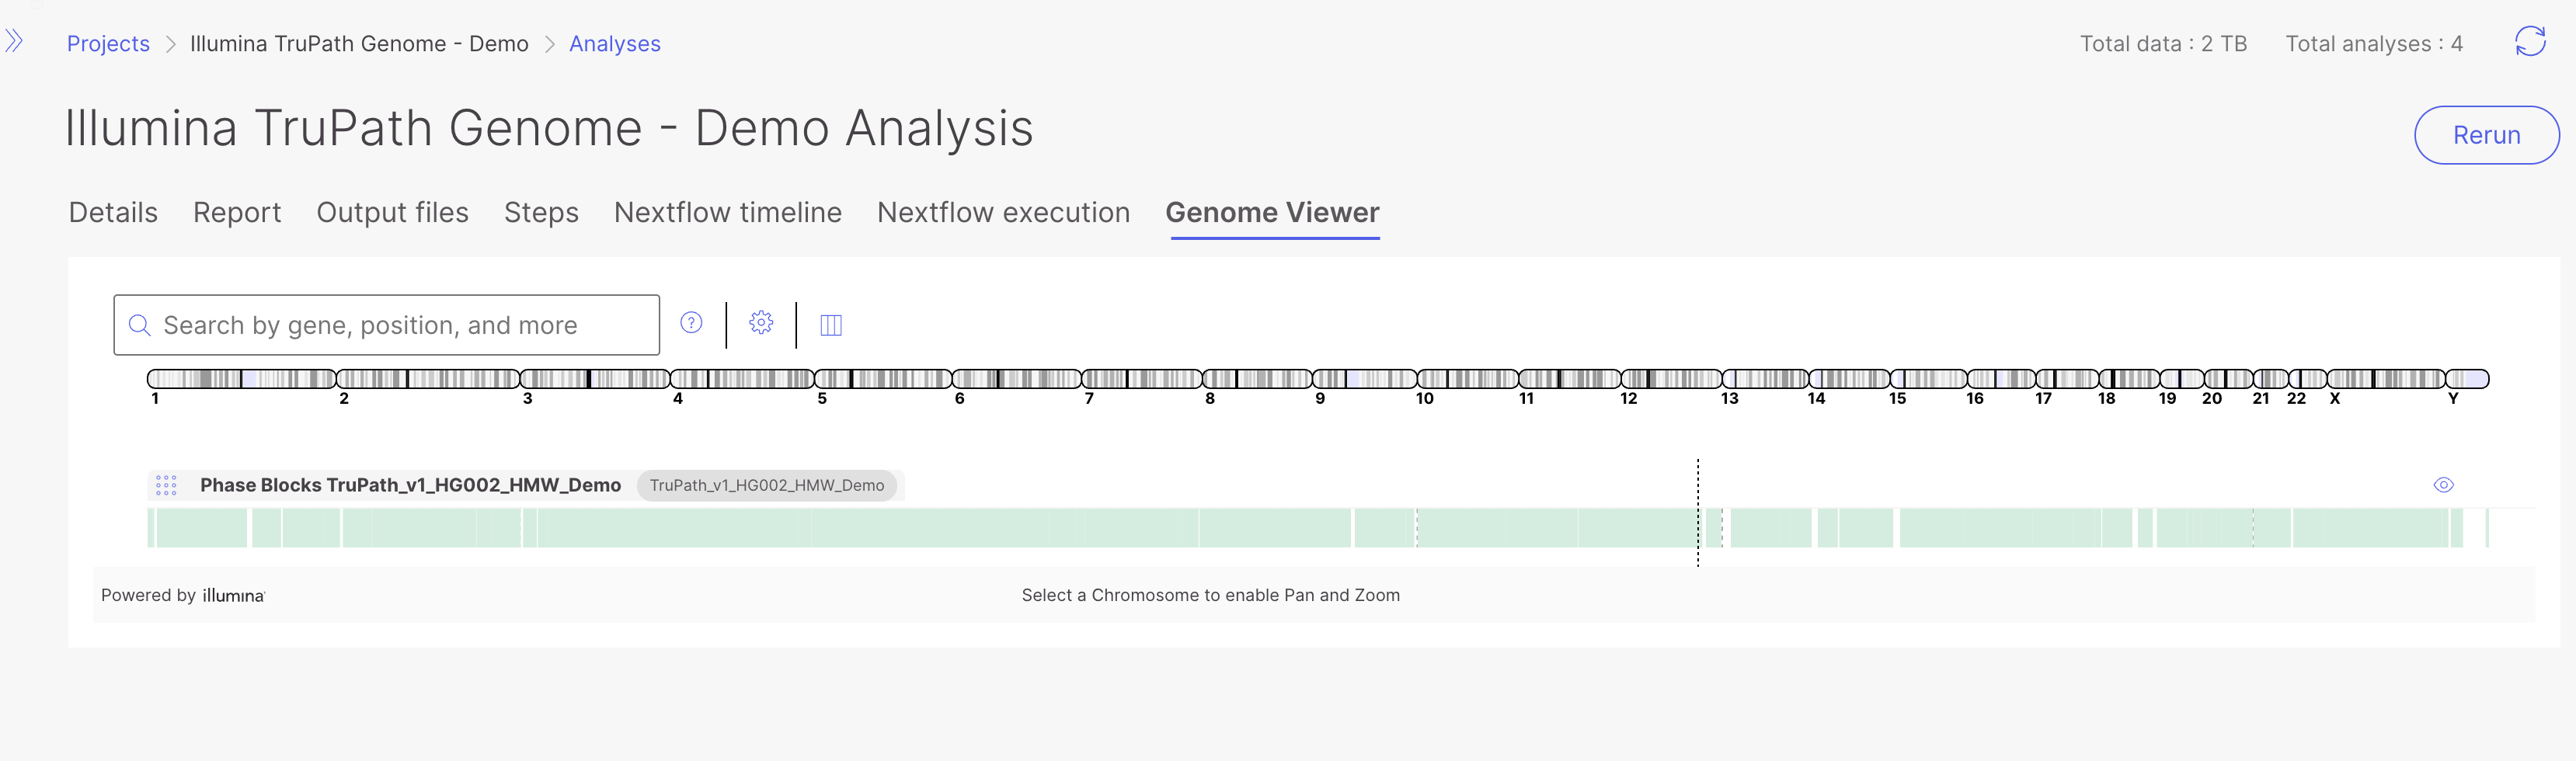
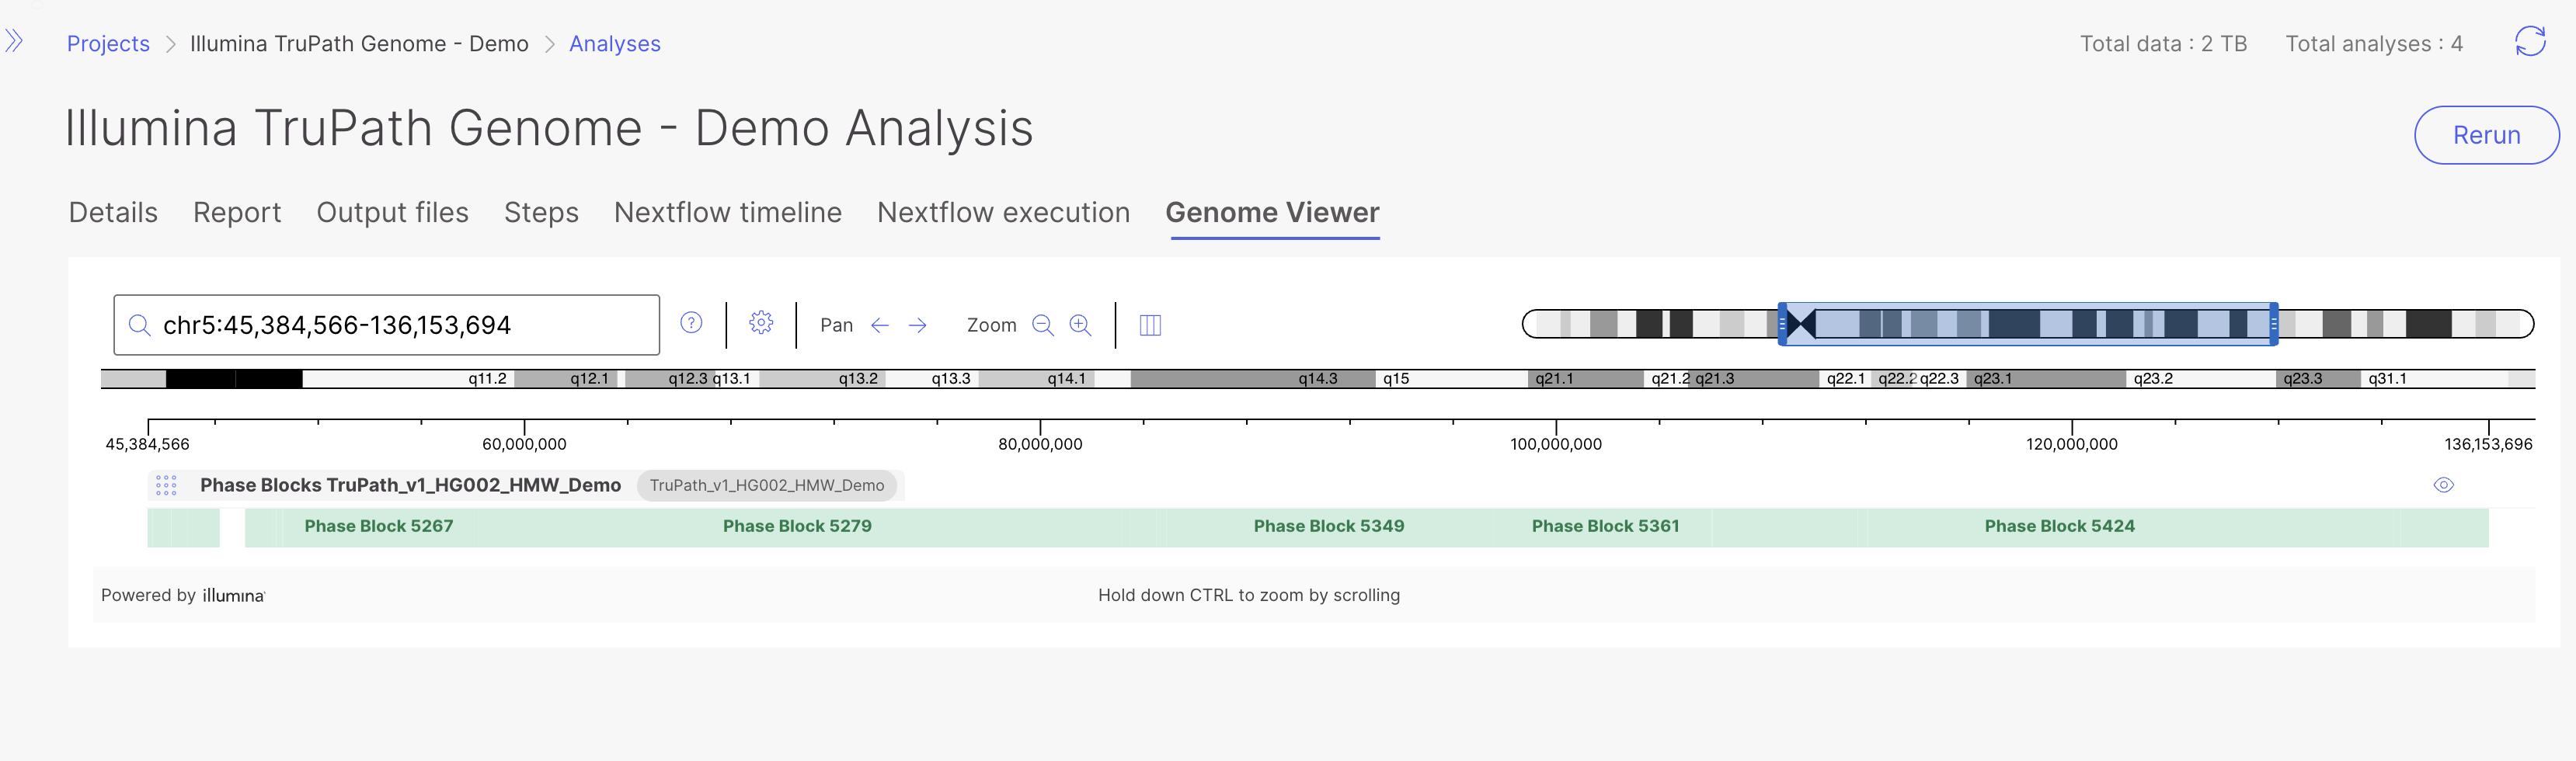
* **What it shows:** The phase blocks (`.phase_blocks.gtf.gz`) that indicate the contiguous regions over which phasing is resolved.
* **When to use it:** Confirming that two variants of interest fall within the same phase block before trusting their relative phase, and understanding where phasing is (and is not) continuous.
Phase Blocks track at the whole genome view (top) and zoomed in over a particular region (bottom):
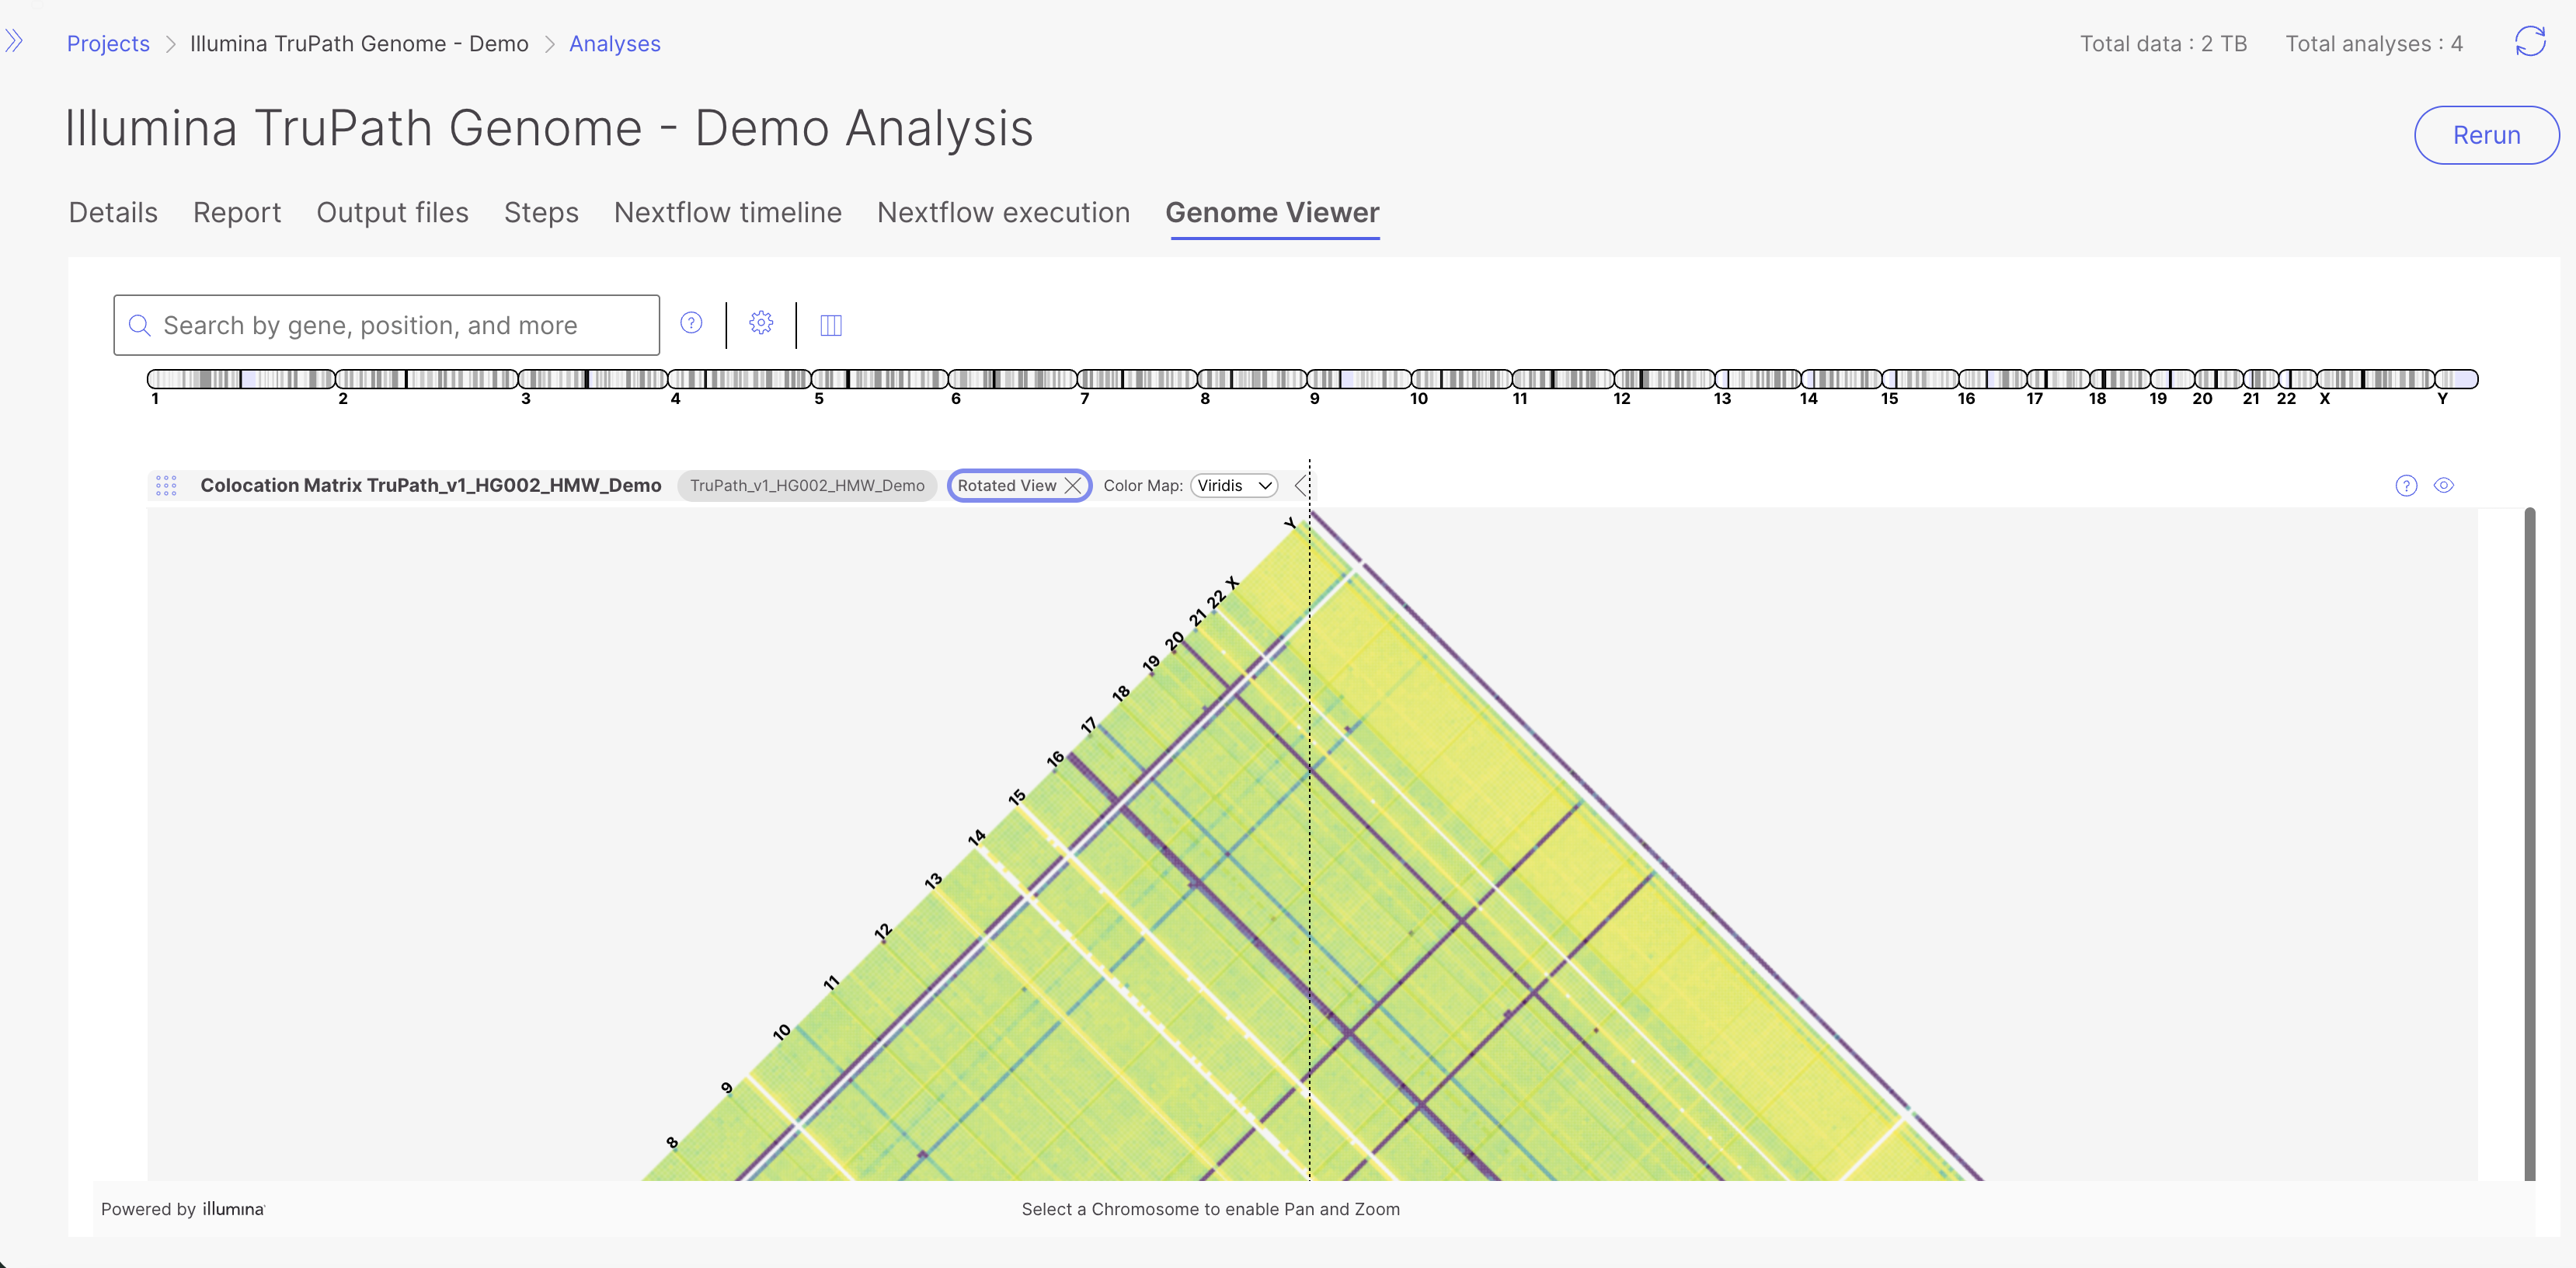
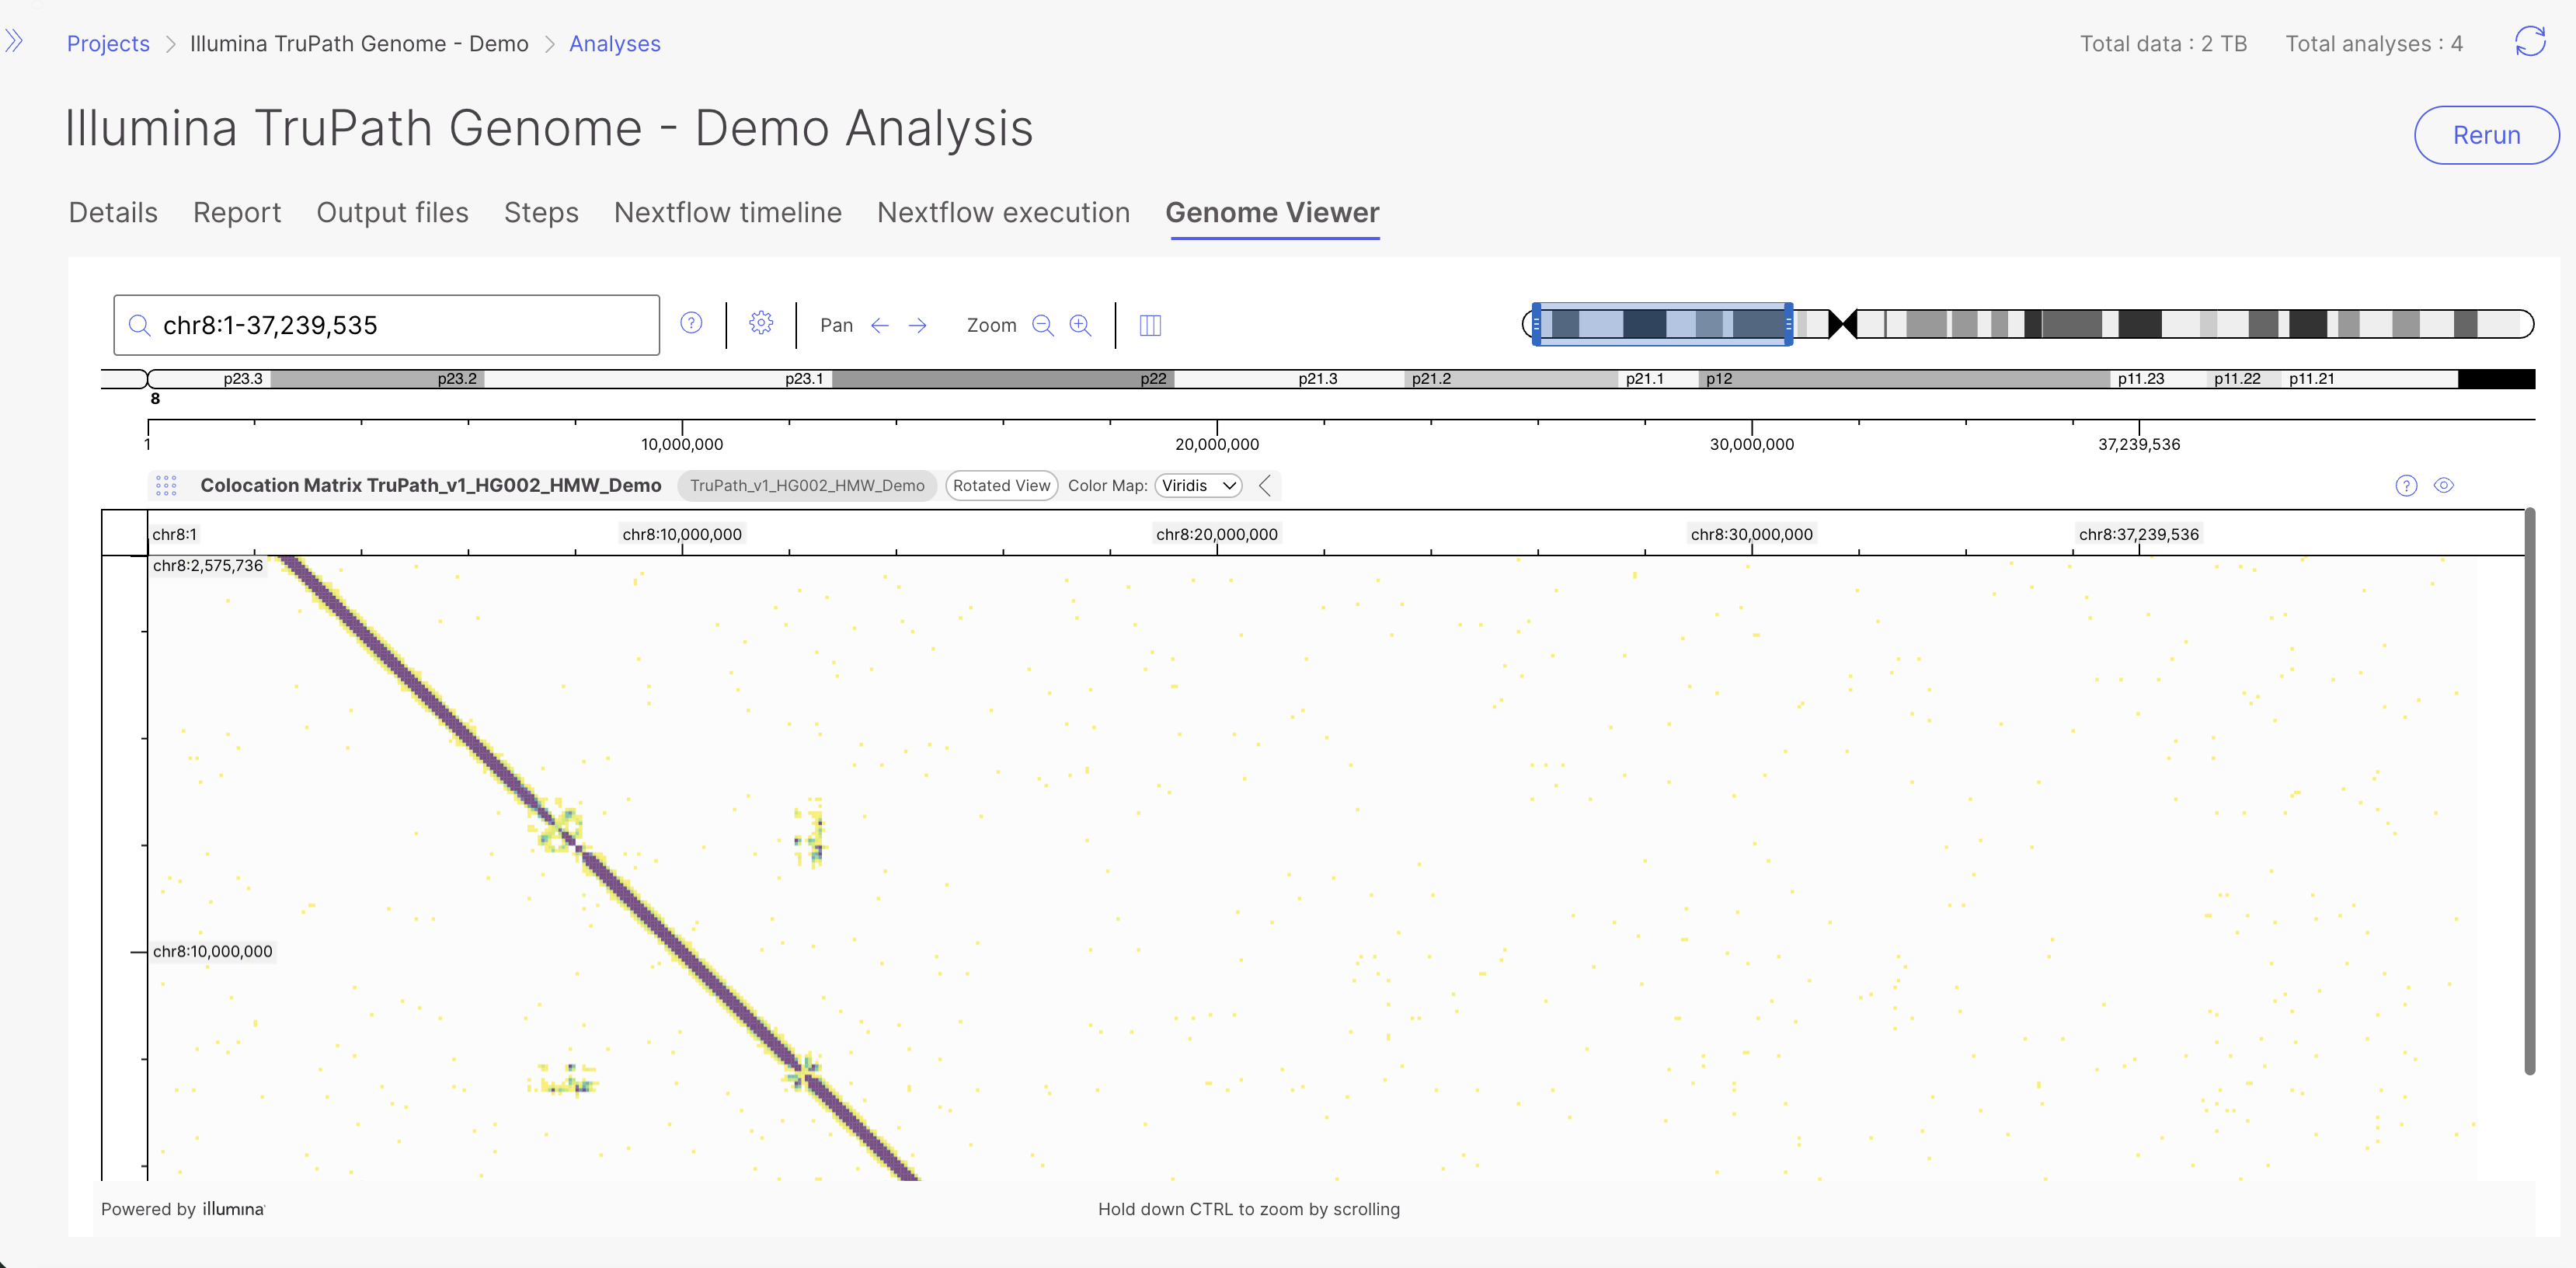
#### Colocation Matrix Track
* **What it shows:** A genome-wide proximity/contact map (`.colocation.hic`) showing how often pairs of genomic regions are observed close together. The color map can be switched between **Viridis**, **Magma**, **Plasma**, **Inferno**, and **Cividis**.
* **When to use it:** Validating structural variants through supporting proximity signal, and exploring long-range relationships between genomic regions that linear tracks cannot show.
Colocation matrix (Hi-C) contact map, zoomed out in the rotated view (top) and zoomed in the unrotated view to a given region (bottom):
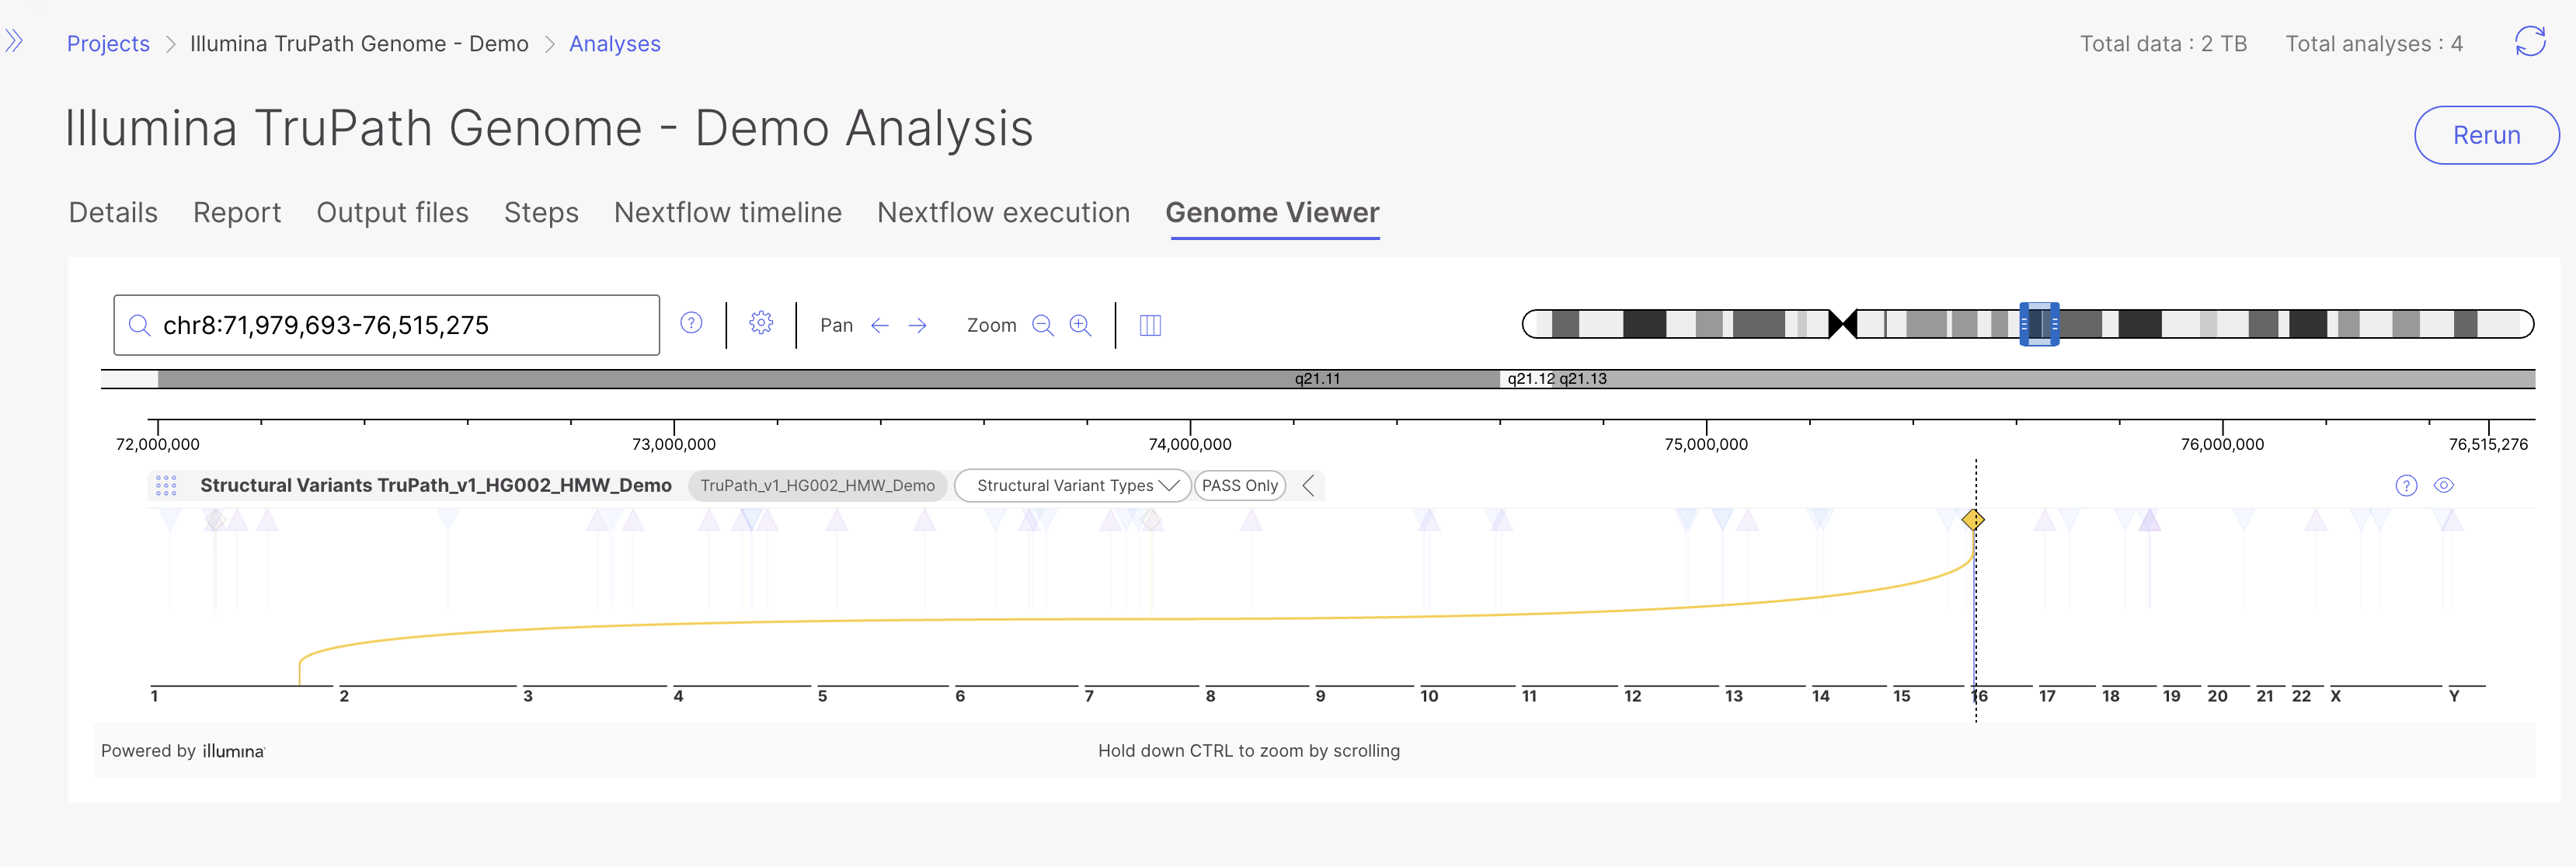
#### Structural Variants (SV) Track
* **What it shows:** Structural variant calls (`.sv.vcf.gz`) such as deletions, duplications, insertions, inversions, and translocations (breakends). Translocation partners can be highlighted, and mate breakpoints can be navigated to from an SV.
* **When to use it:** Investigating large rearrangements, jumping to the mate side of a break end, and correlating SV calls with read evidence in the BAM track and proximity signal in the colocation track.
* **Availability:** Present only when SV calling was enabled for the run.
SV track at the whole genome view (top) and SV track zoomed in with a call selected and its mate breakpoint highlighted (bottom):
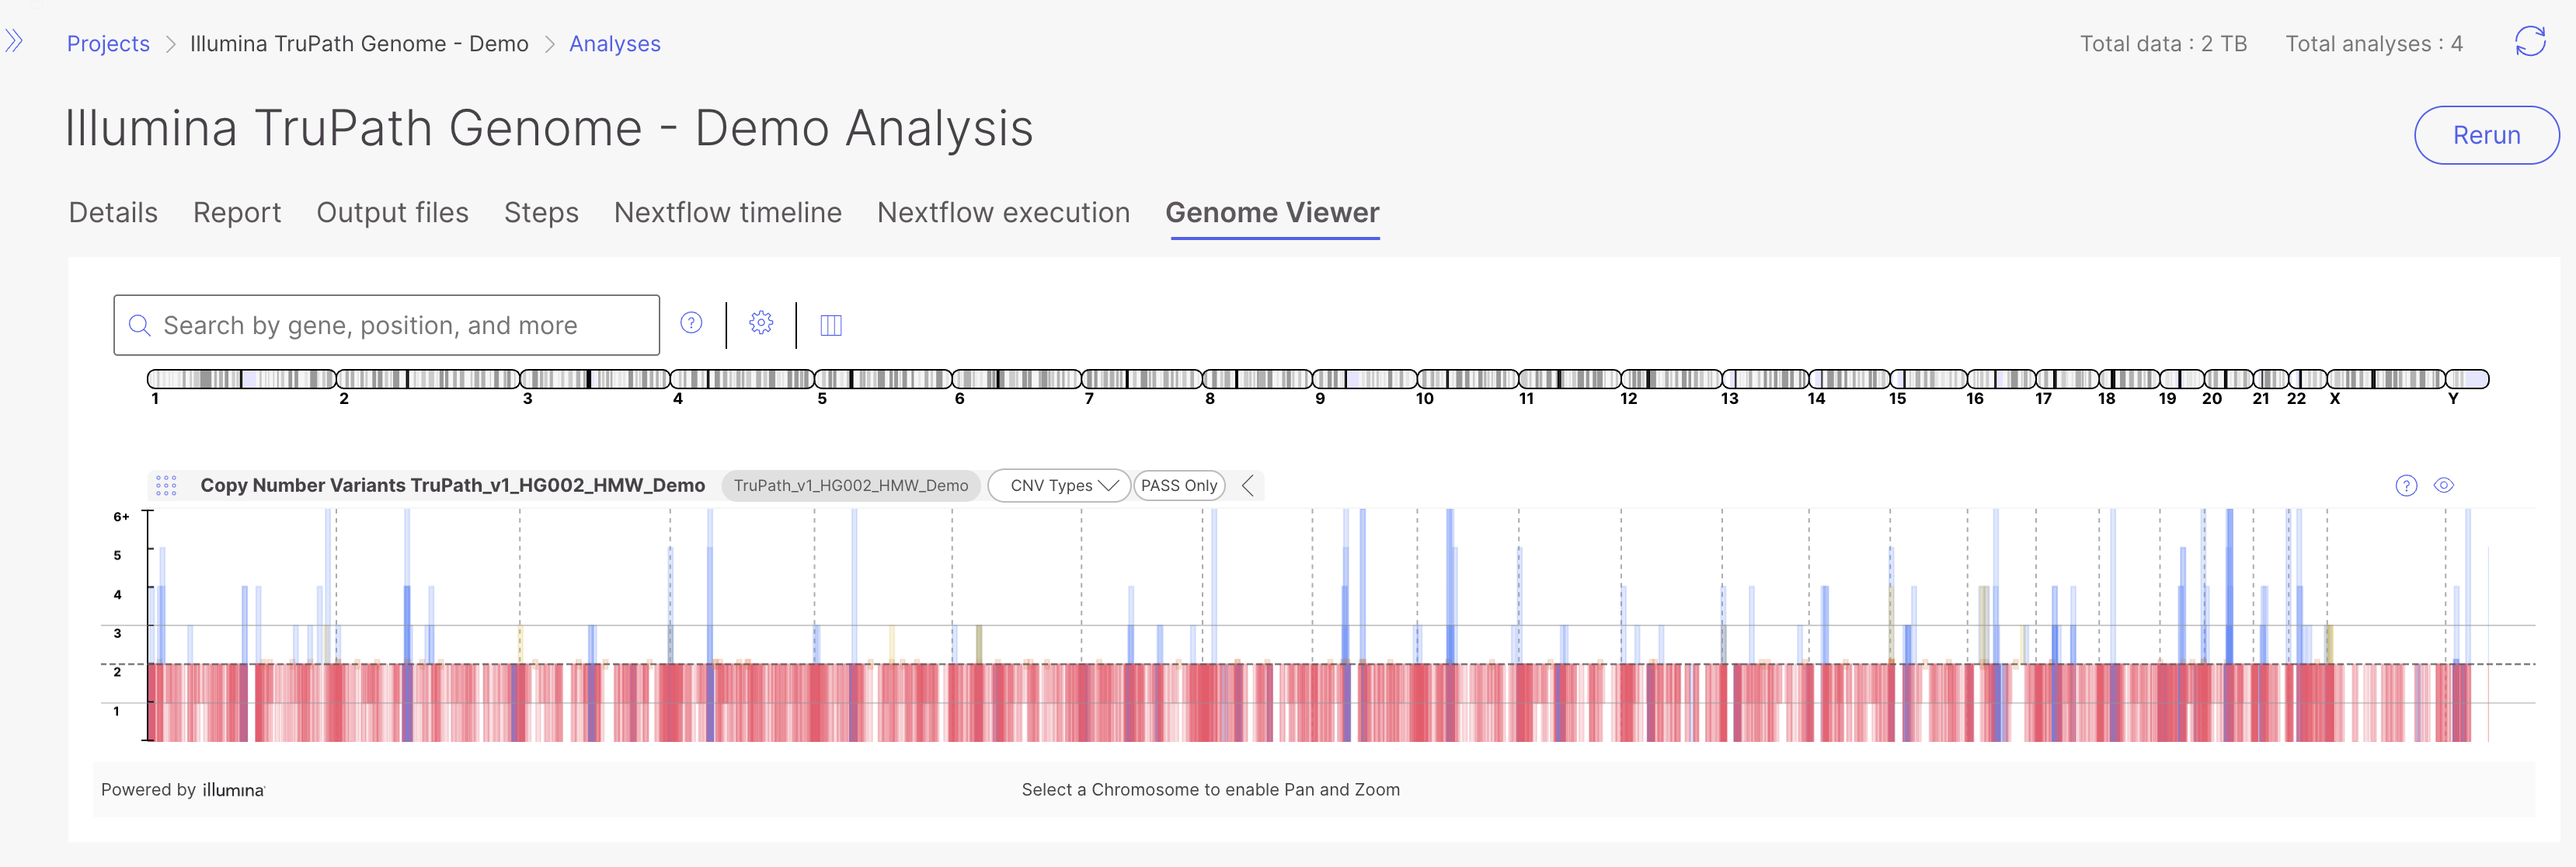
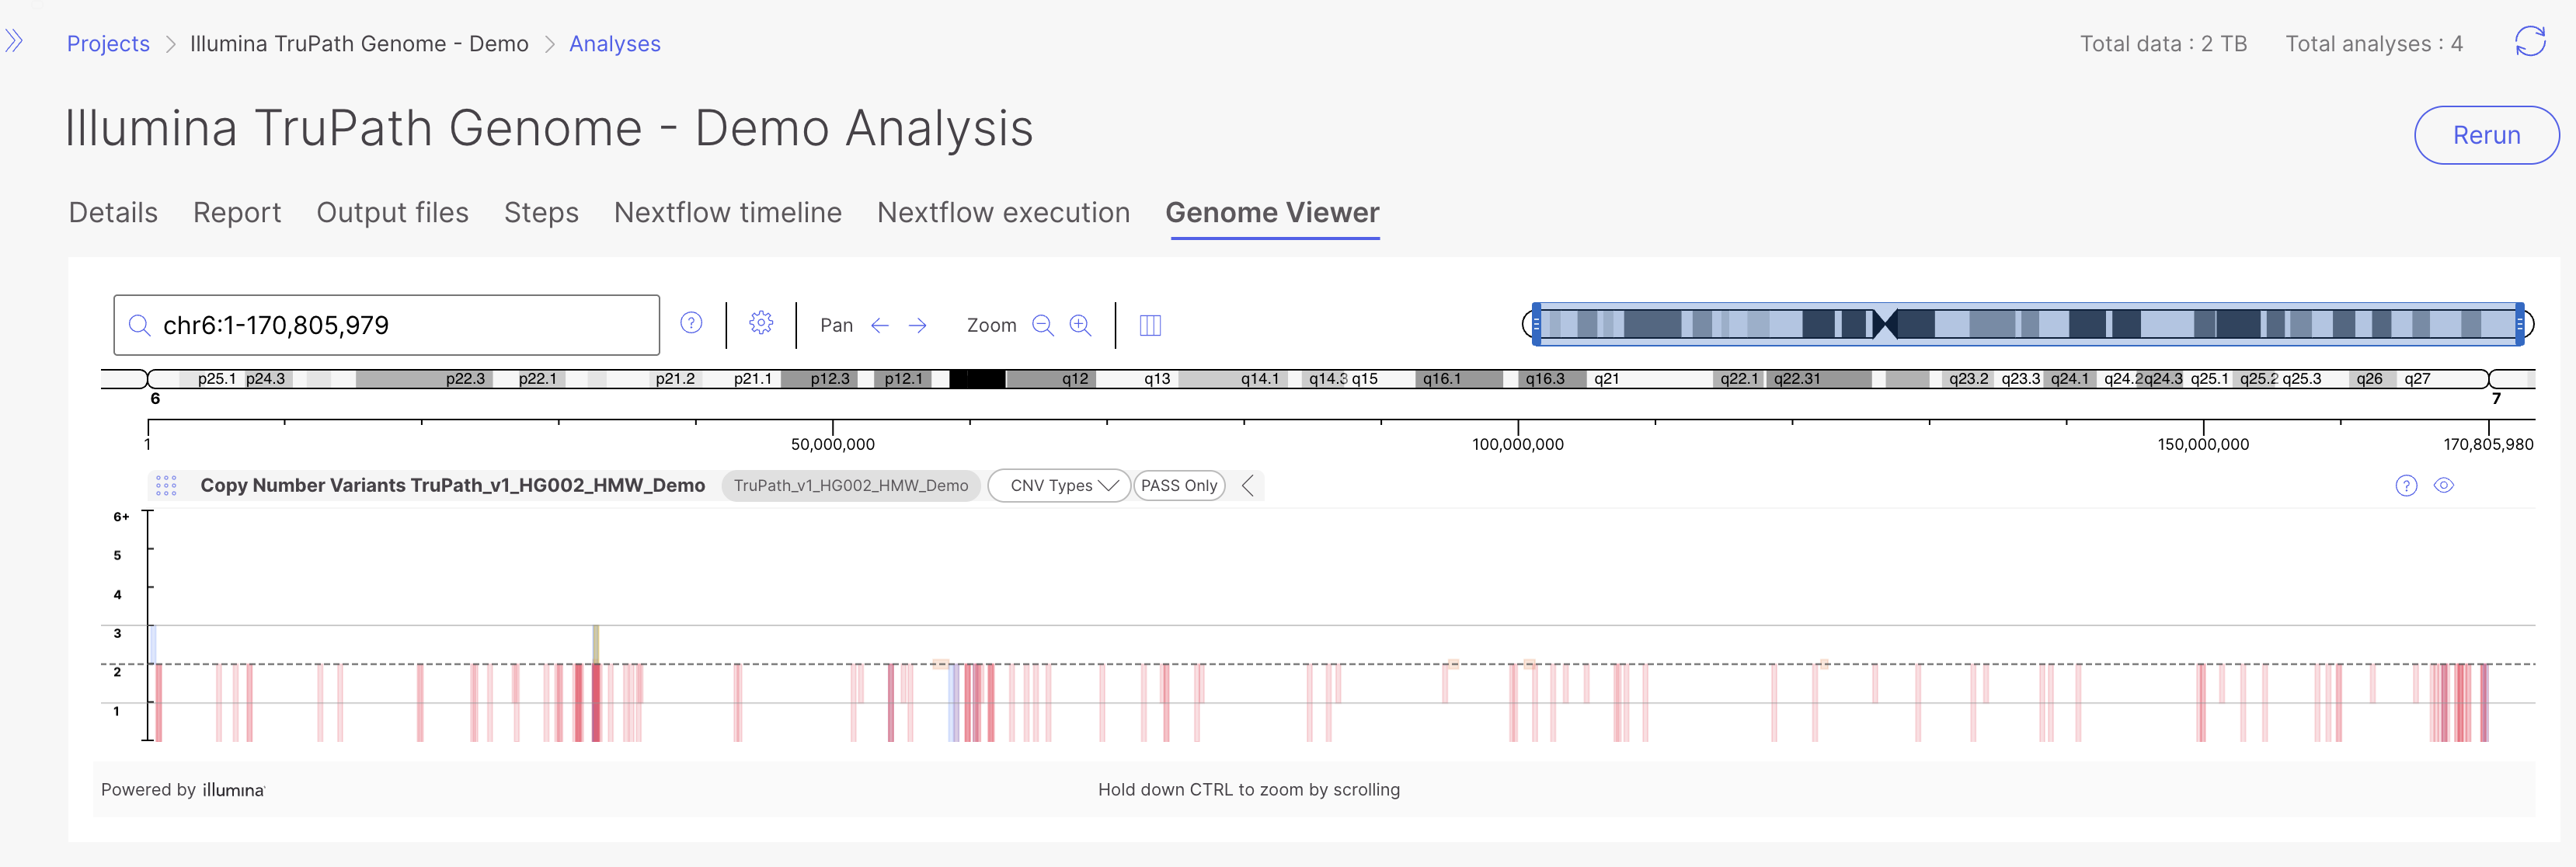
#### Copy Number Variants (CNV) Track
* **What it shows:** Copy number variant calls (`.cnv.vcf.gz`). A **PASS Only** filter is available.
* **When to use it:** Reviewing gains and losses across a region and confirming that a copy number change is consistent with the read depth in the BAM track.
* **Availability:** Present only when CNV calling was enabled for the run.
CNV track at the whole genome level (top) and CNV track zoomed in at a particular region showing a copy number gain or loss (bottom):
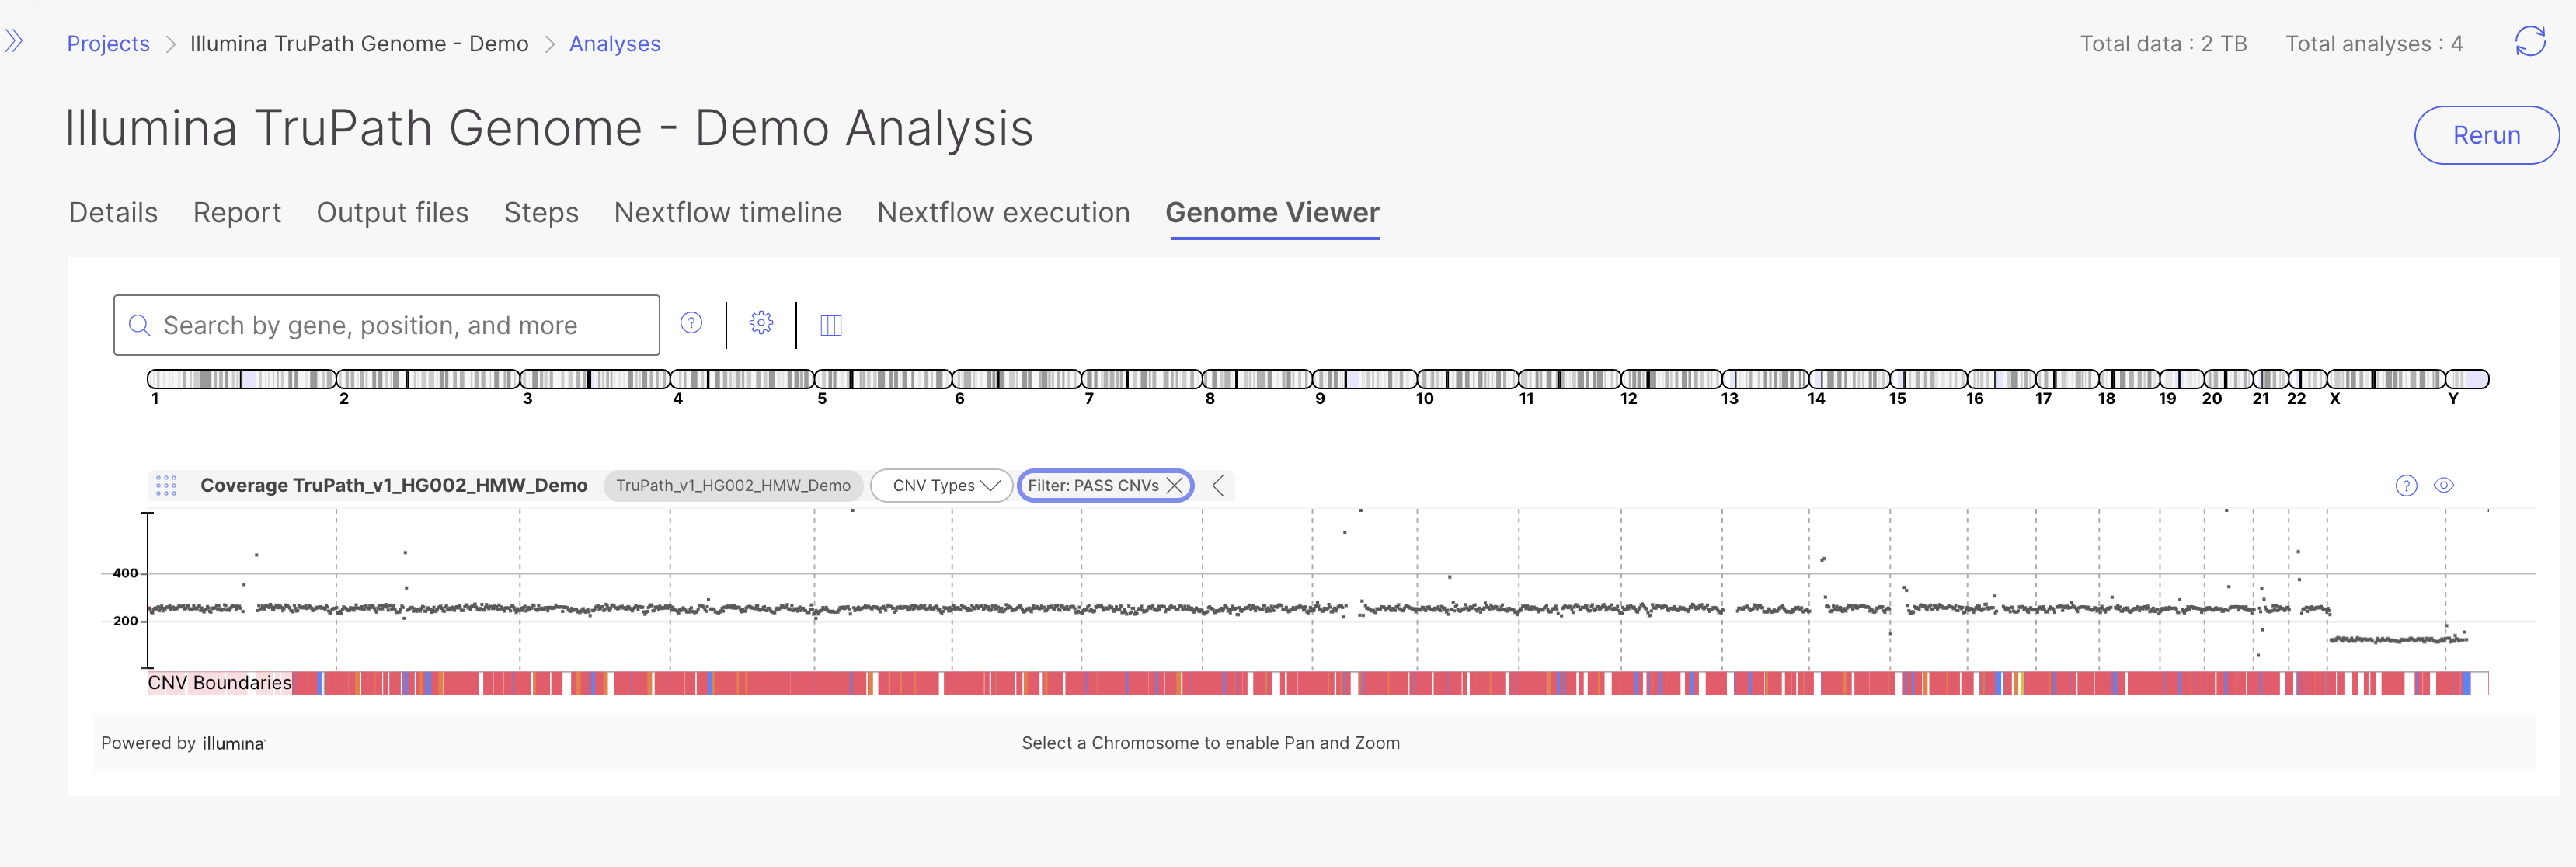
#### Coverage Track
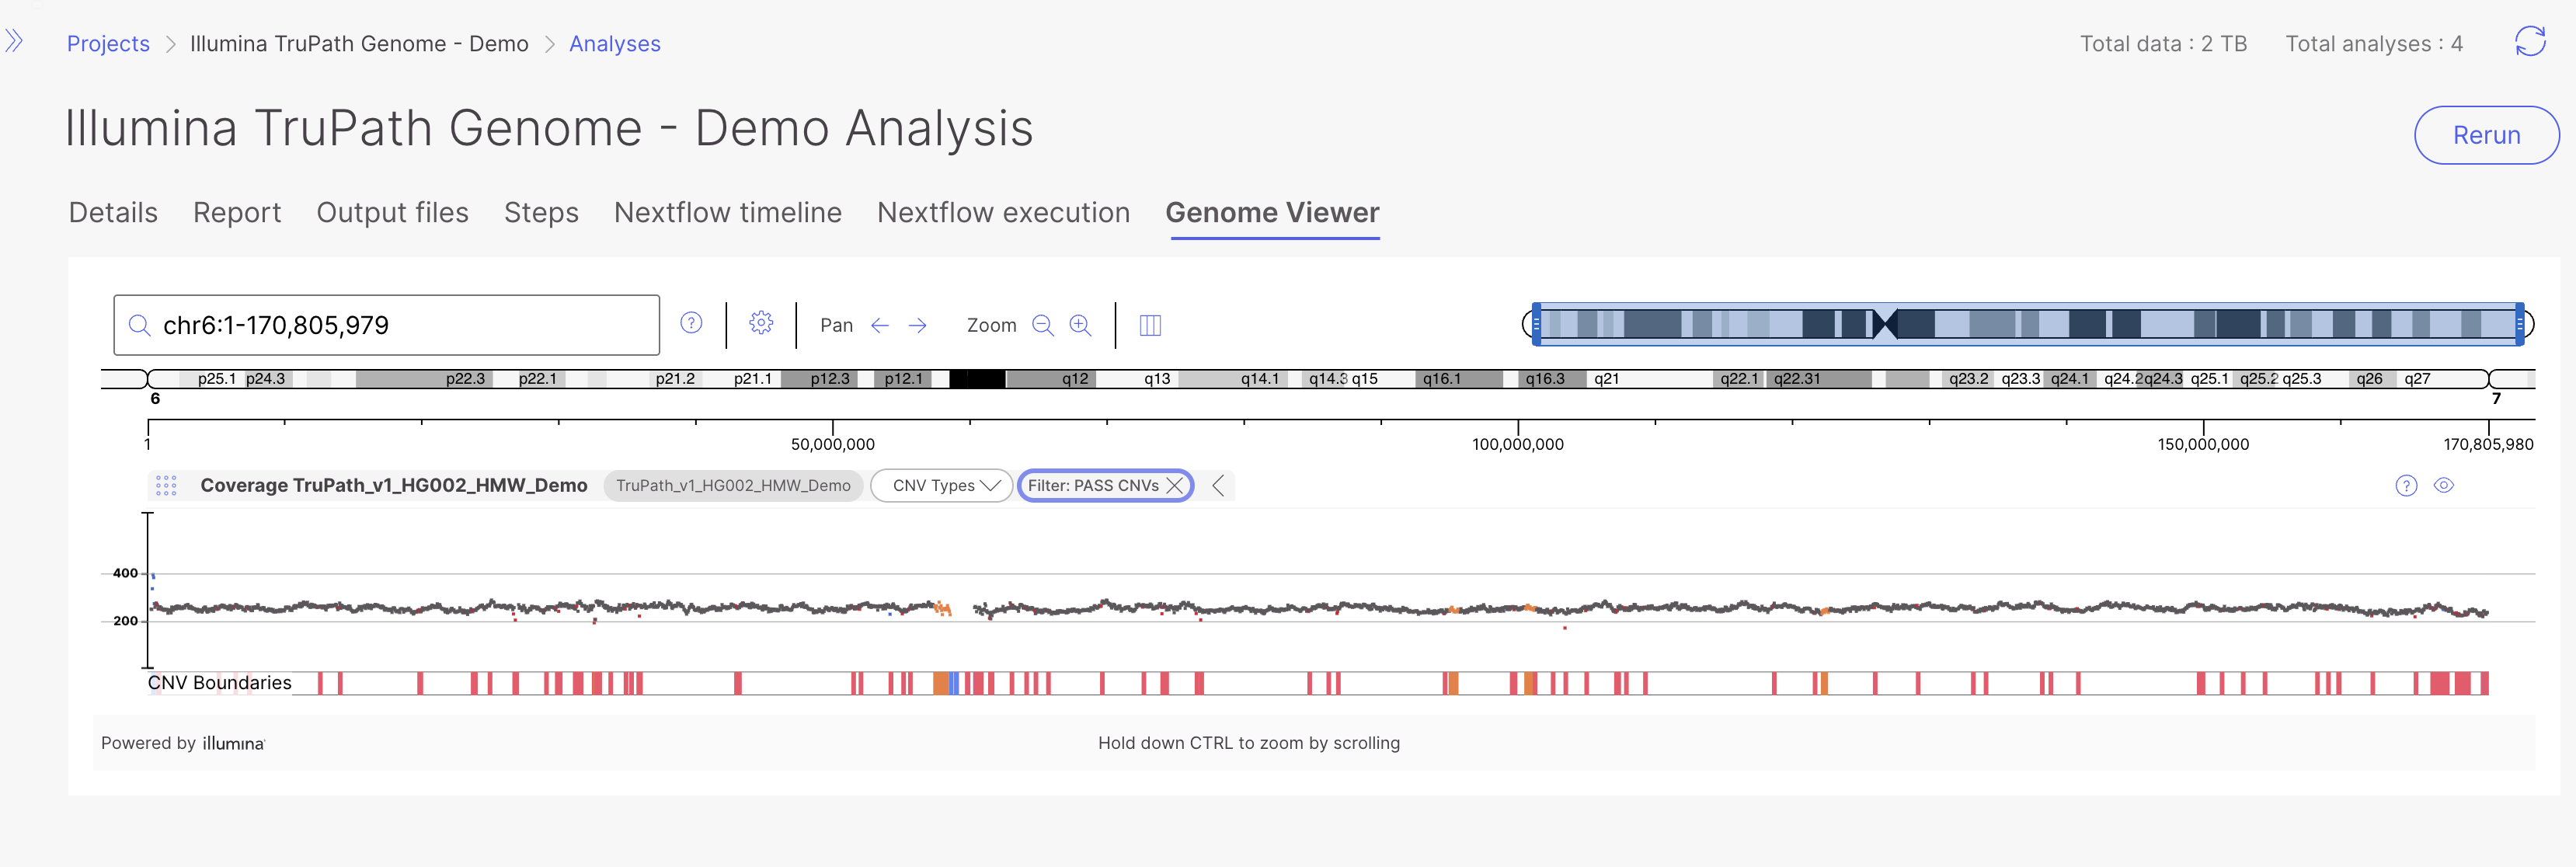
* **What it shows:** Normalized sequencing depth across the region, displayed alongside the copy number calls so that coverage changes and CNV segments can be compared directly. The track combines the coverage signal with the CNV VCF (`.cnv.vcf.gz`), and a **PASS CNVs** filter is available to restrict the display to PASS calls.
* **When to use it:** Confirming that a copy number gain or loss is supported by a corresponding rise or drop in depth, assessing segment boundaries, and distinguishing real copy number changes from coverage artifacts.
* **Availability:** Present only when CNV calling was enabled for the run.
Coverage track shown with CNV segments at the whole genome view (top), and zoomed in to a given region (bottom):
#### B-Allele Frequency Track
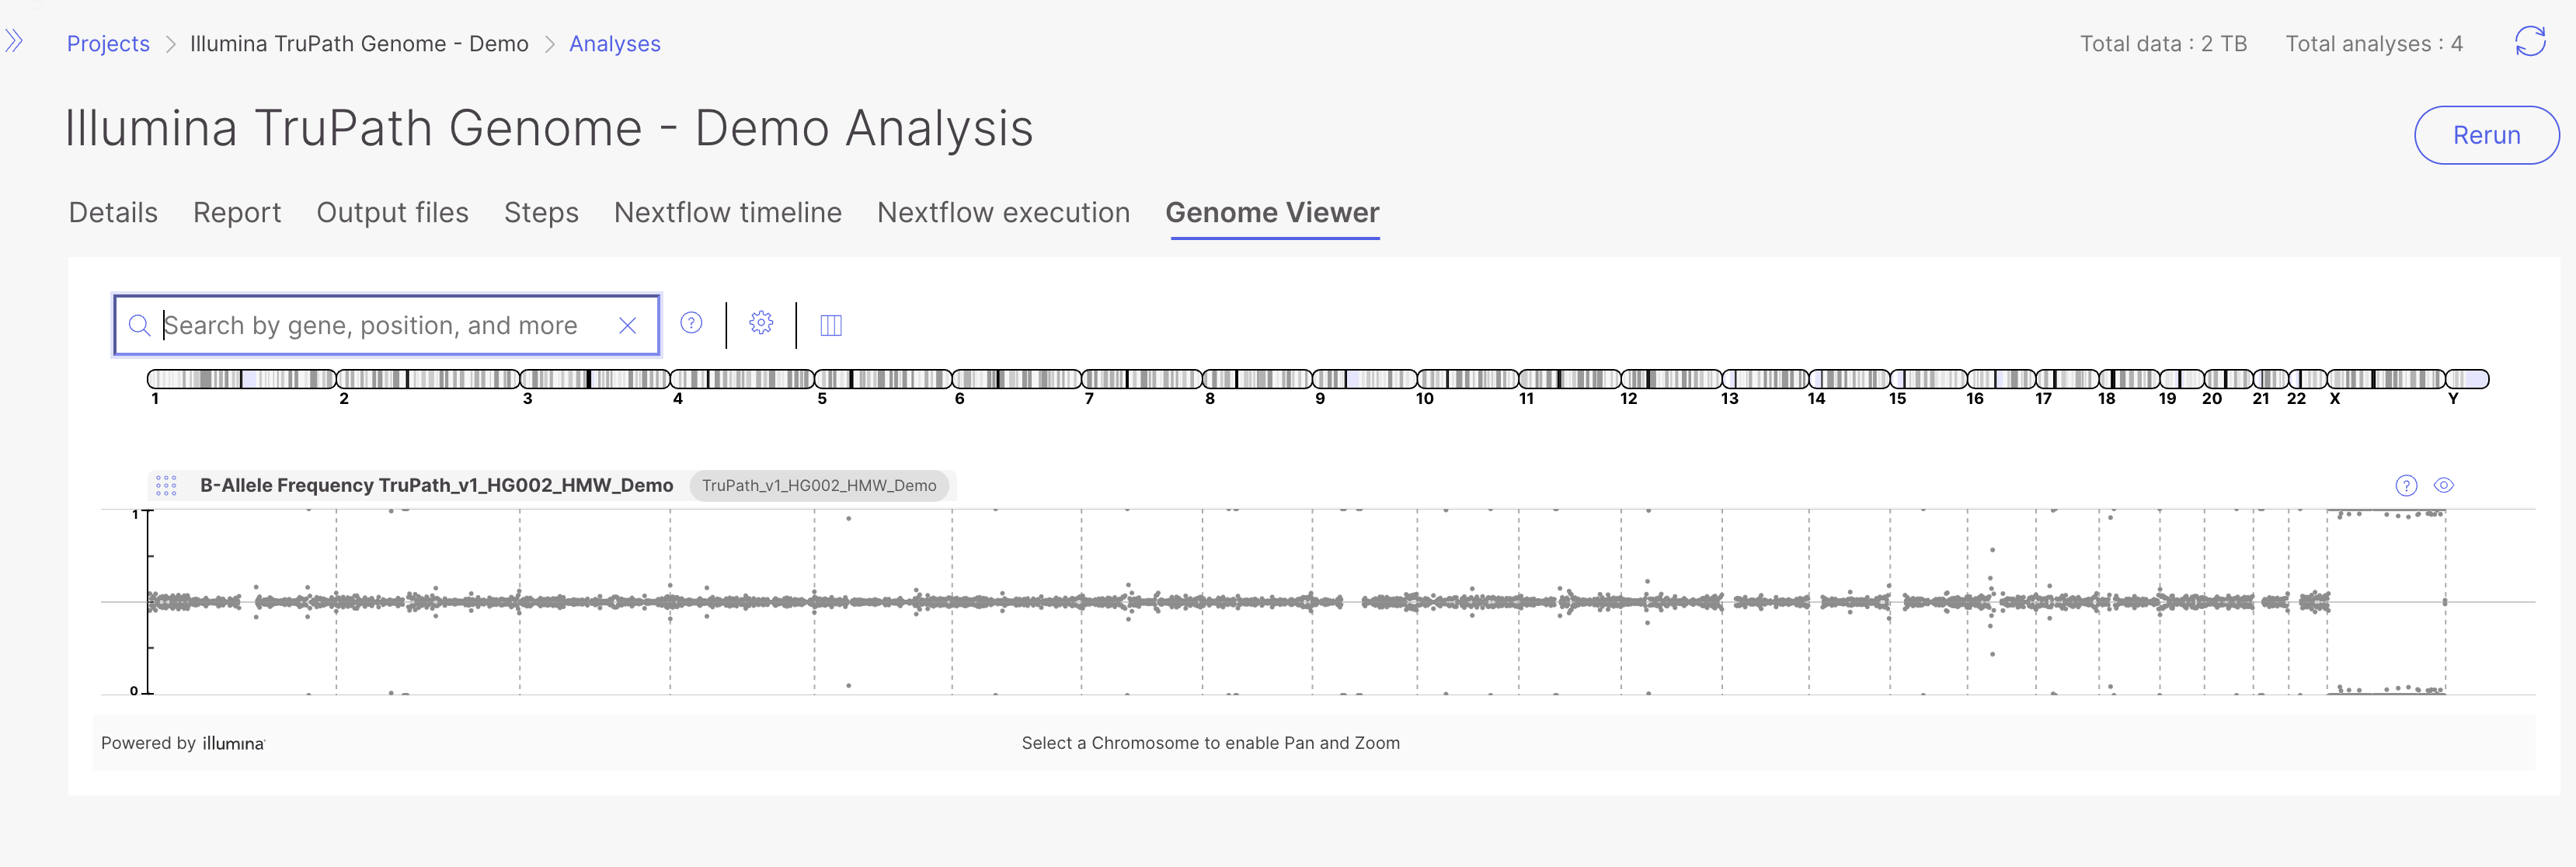
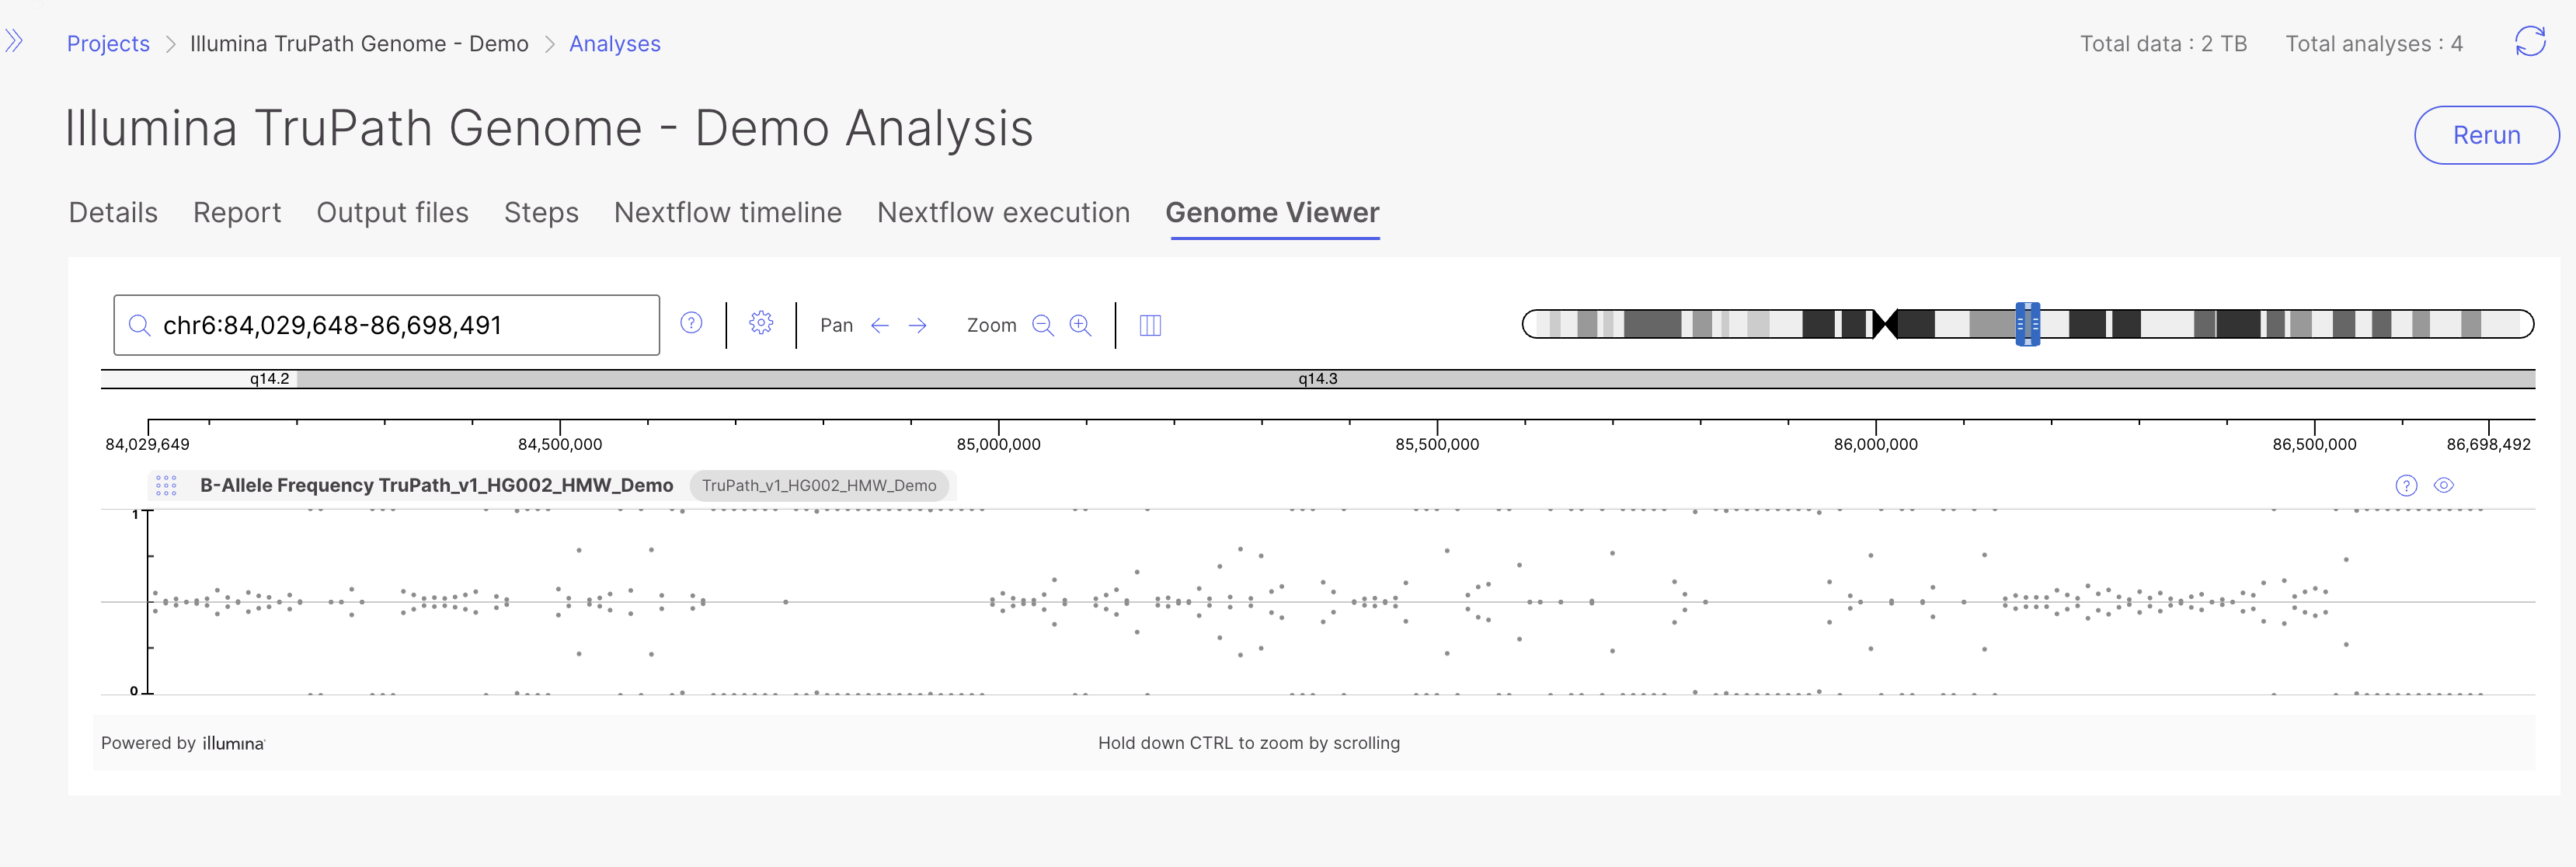
* **What it shows:** The B-allele frequency (BAF) at heterozygous positions across the region, plotted on a 0–1 scale. Characteristic BAF patterns (for example, a split away from 0.5, or a shift toward 0 and 1) help reveal allelic imbalance, loss of heterozygosity, and the zygosity context of copy number changes.
* **When to use it:** Corroborating CNV calls with allelic evidence, identifying copy-neutral loss of heterozygosity that depth alone cannot show, and refining the interpretation of gains and losses seen in the coverage and CNV tracks.
* **Availability:** Present only when CNV calling was enabled for the run.
B-allele frequency track zoomed out at the whole genome view (top), and zoomed in at a given region (bottom):
### Key features
* **Filtering** — Variant tracks provide a **PASS Only** filter to focus on high-confidence calls. Read display can be constrained by quality where supported.
* **Coloring and grouping** — BAM reads can be colored/grouped by haplotype, read strand, first-of-pair, or pair orientation; SNP variants can be colored by substitution or variant type; the colocation matrix supports multiple color maps.
* **Phasing visualization** — Haplotype 1 and Haplotype 2 are shown separately in the SNP track, and reads are haplotagged in the BAM track, making it straightforward to determine phase and assess compound heterozygosity.
* **Interactive elements** — Click genes to inspect them, click structural variants to view details and jump to their mate breakpoint, and highlight translocations that end on a selected chromosome.
* **Synchronized navigation** — Tracks belonging to the same sample move together during search, zoom, and pan.
PASS Only filter applied to a variant trackColor-by / Group-by dropdown open on the BAM track
### Related topics
* Multi-Region Joint Detection (MRJD)
* Structural Variant IGV Tutorial
* DRAGEN Reports
---
# Agent Instructions
This documentation is published with GitBook. GitBook is the documentation platform designed so that both humans and AI agents can read, navigate, and reason over technical content effectively. Learn more at gitbook.com.
## Querying This Documentation
If you need additional information that is not directly available in this page, you can query the documentation dynamically by asking a question.
Perform an HTTP GET request on the current page URL with the `ask` query parameter, and the optional `goal` query parameter:
```
GET https://help.connected.illumina.com/illumina-trupath-genome/data-visualizations-and-analysis/visualize-data-in-platform-core.md?ask=&goal=
```
`ask` is the immediate question: it should be specific, self-contained, and written in natural language.
`goal` is optional and describes the broader end goal you are ultimately trying to accomplish on behalf of the user. GitBook uses it to tailor the answer towards what is most useful for that goal.
The response will contain a direct answer to the question and relevant excerpts and sources from the documentation.
Use this mechanism when the answer is not explicitly present in the current page, you need clarification or additional context, or you want to retrieve related documentation sections.



.png?alt=media)